Diversification is now at the centre of corporate supply chain strategies and governments’ industrial policies. It is beginning to have a tangible impact on world trade.
The global pandemic and the ongoing geopolitical tension have placed diversification at the centre of corporate supply chain strategies and governments’ industrial policies. Three years after the beginning of the global pandemic, to what extent has supply chain diversification been implemented? To address this question, we analyse the economic activities of the main supply chain diversification countries in two articles through the prism of both trade and foreign direct investment (FDI).
A more glaring diversification in the US trade
When comparing China's trade links with the EU and the US, we can see that the US is diversifying its trade much faster than Europe (Figure 1). Over the past five years, the Chinese share in US imports has dropped from 21% in 2018 to 17% in 2022, though the absolute trade volume between China and the US continues to grow.
Conversely, the EU-China trade shows a rather complex pattern. China's share in the EU's total imports (including intra-EU and extra-EU) rose from 7% in 2018 to 9% in 2022, but its share in the EU’s imports from non-EU countries fell in the past two years. The energy crisis and geopolitical scenarios limited the intra-EU sourcing and pushed for growing external energy demand, such as the US LNG.
In the case of the US, where diversification is more prominent, machinery goods presented the most significant trade diversion, primarily to Southeast Asia and Taiwan. China-US trade in the automotive sector is relatively resilient, but Mexico’s position as a key automotive sector supplier to the US has also been reinforced.
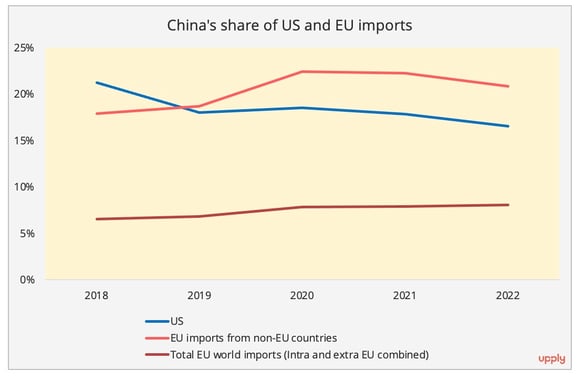
Figure 1- Data Source: Census Bureau and Eurostat.
A minor decrease in Chinese supply in 2022
The reliance of these diversification countries on Chinese intermediate goods and raw materials has always been a standing issue. In this article we have surveyed the trade in intermediate goods with China for the ASEAN, Mexico, India and selected countries of Central and Eastern Europe (Poland, Slovakia, Czech, Hungary and Romania[1]).
ASEAN, Mexico and India all saw a burgeoning share of Chinese intermediate goods until 2021 and then a drop in 2022. In 2021, China's early resumption of production immediately propelled record-high exports, as the pandemic continued to curb other countries' output. However, the scenario was reversed in 2022. The harsh lockdown in China has translated into a minor loss of China’s exports to these countries, especially as recipient countries were gradually phasing out pandemic restrictions.
In the ASEAN case, a minor drop in Chinese share of imports in 2022 was discernible in the machinery and textile industries (Figure 2), the two industries with the most noticeable implementation of "China plus one." Although mainland China remains the dominant intermediate/raw materials supplier to ASEAN, we observed increased imports from Taiwan and South Korea in the machinery goods sector and burgeoning intra-ASEAN sourcing for the textile industry.
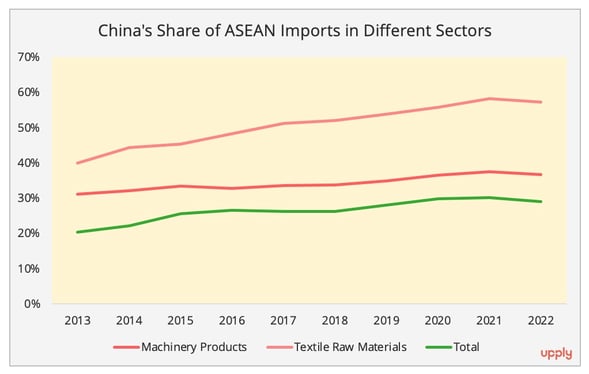
Figure 2 - Data Source: ASEAN Stats[2].
As for the case of Mexico, the Chinese supply of car parts has been buoyed in the past decade, rising from 3.6% in 2012 to 10.2% in 2021[3]. Data on China-Mexico trade in car parts for 2022 are not yet available, but it can be seen that China's share of the overall supply of intermediate goods to Mexico has fallen slightly, especially in the second half of 2022 (Figure 3). In December 2022, it dropped to 2019 levels.
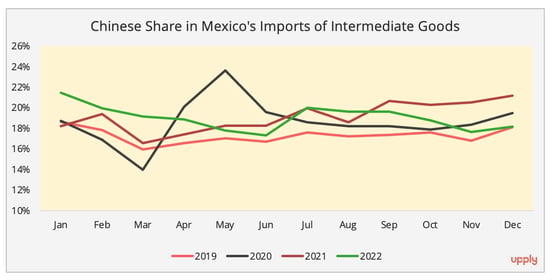
Figure 3 - Data Source: Mexico Statistics Bureau.
This is the same case for India. Here we use Indian imports of machinery goods[4] as an example, as both Indian government and foreign enterprises have expressed major interest in expanding the manufacturing capacity in this sector in India (e.g., the new Foxconn plant for Apple). In the field of machinery production, although China remains a dominate supplier, its share also saw a minor decrease in 2022 (Figure 4), along with growing sourcing from Singapore, South Korea, and Vietnam. The substantial greenfield FDI into India last year sheds further light on its potential in manufacturing activities. In the first nine months of 2022, India was the largest recipient of greenfield investment in the Asia Pacific region, receiving 60 billion USD of FDI, outpacing China for the first time.
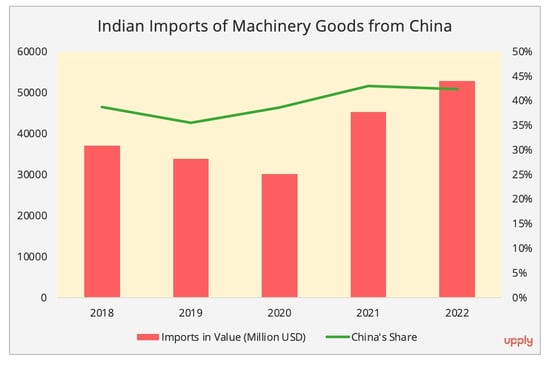
Figure 4 - Data Source: Indian Ministry of Commerce and Industry.
The only exception among the surveyed regions is the five Central and Eastern European (CEE) countries. China's position as an intermediate goods supplier to CEE countries has been fortified over the years and has accelerated since 2020 (Figure 5)[5]. In the case of Poland, the largest economy in the CEE region, Chinese intermediate goods accounted for 34% of its imports of these products from non-EU countries, while the figure was only 20% a decade ago.
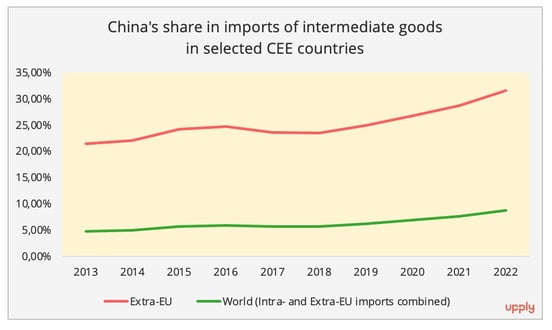
Figure 5 - Data Source: Eurostat.
Temporary or Lasting Trend?
The strict lockdown in China in 2022 and ongoing geopolitical tension have further pushed foreign enterprises to develop a supply chain diversification strategy. The reopening of China could potentially change this trend. Indeed, Chinese exports in the first quarter of 2023 showed slight growth (+0.5%) and the country recorded a better-than-expected GDP (+4.5%). However, the Chinese trade pattern shows transformations in trade partners and export products, suggesting the emergence of a new supply chain model.
Regarding export destinations, besides the surge in China-Russia trade, Chinese exports to supply chain diversification countries, such as ASEAN, Mexico, India, and Turkey, also buoyed. In contrast, Chinese exports to the EU and the US continued to decline. To the CEECs, they also contracted, but at a much more moderate pace than to their Western neighbours (Figure 5). This may suggest a continued expansion between China and these preferred countries as supply chain diversification options.
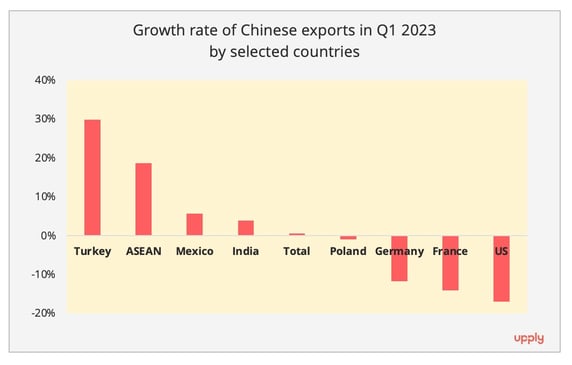
Figure 6 - Data Source: China Customs.
A divergence also occurred in the exported commodities in the first quarter of 2023. On the one hand, the Chinese automotive industry, a field the government seeks to champion in the global market, continues to show a strong performance, with a significant increase in export of both vehicles (+ 81.6%/value term) and car parts (+11.3%/value term). With the Chinese government ending the EV purchasing subsidy, the gloomy domestic automotive market, and strong Chinese policy support for EV exports, the way is paved for continuing dynamic exports from the Chinese automotive industry.
On the other hand, the weak external demand is still curbing the performance of the top Chinese export commodities, namely electronic machinery goods. For example, in the first quarter, some of the leading products in this category suffered, Chinese cellphone exports dwindled by almost 10%, and data processing appliances and parts plunged by nearly 30%, according to China Customs.
Exports in this category are not likely to see an easy recovery especially considering the sluggish demand. This is the case outside of China too, countries that benefited from the "China Plus One" strategy also feel the pain of weak external demand. For example, the exports from Vietnam, which has emerged as a machinery production hub, dropped by 11% in the first quarter of 2023. Vietnam's Manufacturing Purchase Manager Index in April (46.7) sliding further into contraction since March, with new orders decreasing at the fastest pace by far in 2023, according to the S&P Global. This connotes a flat trade performance. As a consequence, weak production in these countries will inevitably lead to a more conservative demand for production materials, for which China has long been the dominant supplier. Not to mention, these countries are also seeking diversification, as they are facing greater compliance requirements in light of importation regulations imposed by countries such as the US, on Chinese products.
In this article we have focused on short-term trends. But the process of diversifying supply chains requires financial resources and time to manifest itself fully. Therefore, in our next article we will look at the analysis of foreign direct investment in the main countries concerned, in order to identify potential avenues for long-term change in the reconfiguration of supply chains.
[1] Without further clarification, the data related to CEE countries in this paper all refers to data of these five countries.
[2] The 2022 intermediate goods trade data between ASEAN and China is not yet available. However, because ASEAN imports remain more export driven, production material constitutes the lion’s share of ASEAN imports. For example, in January 2023, 93% of Vietnamese total imports were production materials. Therefore, the total imports of the selected sectors also serve as a good reference to understand the trend. This same logic applies to the Indian case, as we do not have the 2022 intermediate goods trade data between India and China.
[3] Data source: OECD End-Use data
[4] Machinery goods refers here to trade data of HS codes 84 and 85.
[5] The data related to intermediate goods and consumer goods are based on BEC categorization. As our focus is on the manufacturing industry, we excluded commodities in the food and energy sectors. Intermediate goods refer to codes: 21*, 22*, 42*, and 53*.