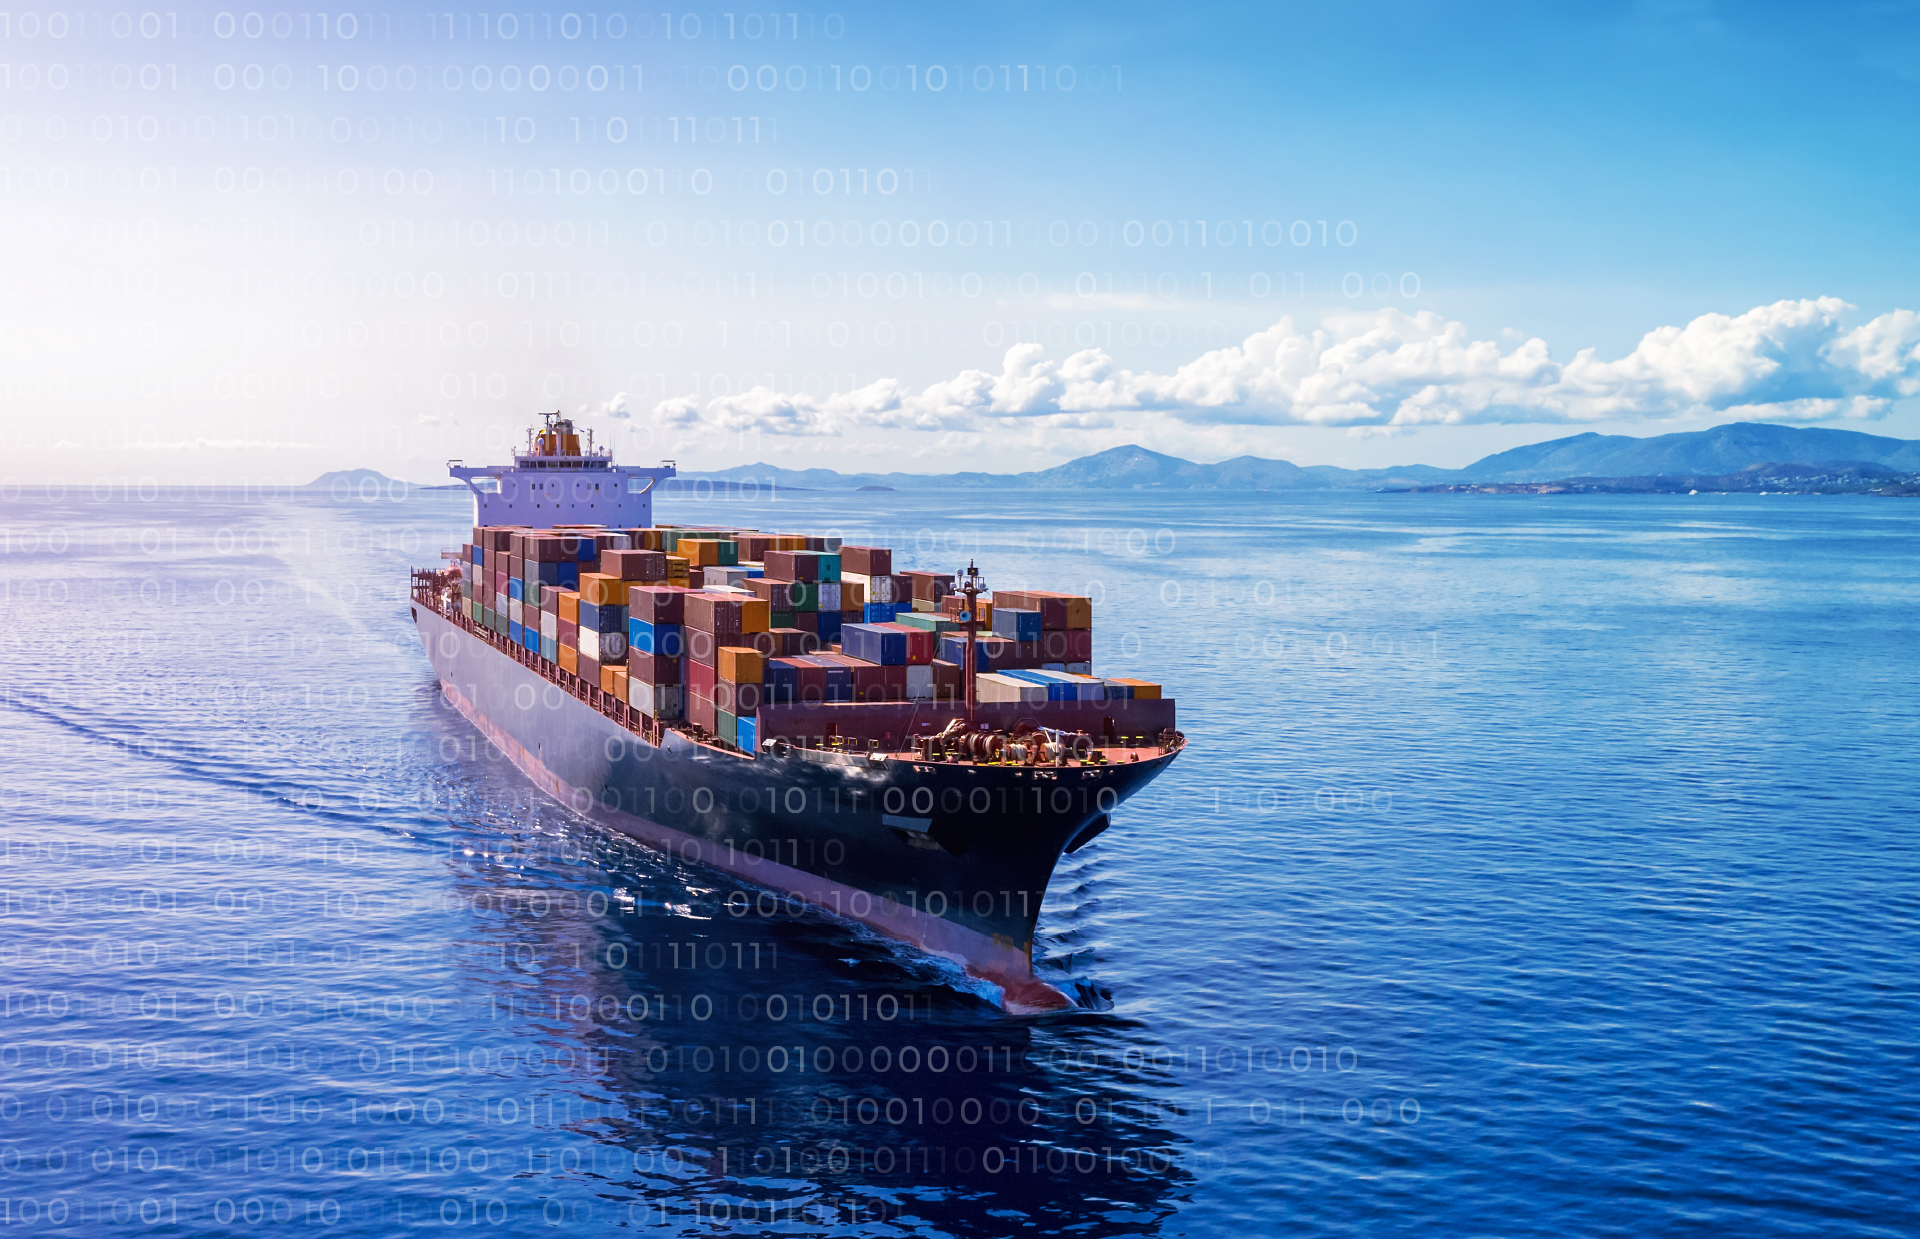
These last 10 years, three things have particularly marked European road transport: a sharp increase in average kilometers covered per trip, the leadership of the Polish lorry fleet over international transport in Europe and a very significant reduction in kilometers covered without loads.
The period after the summer holidays is a good one to carry out studies, given that reading time is limited by the combined pressure of the return to activity and the need to draw up budgets.
Here, I propose a quick assessment of the last 10 years of European road freight transport using European statistics from the Eurostat data base.
Three key factors
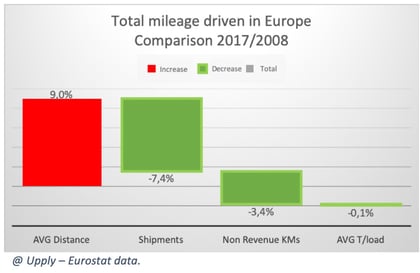
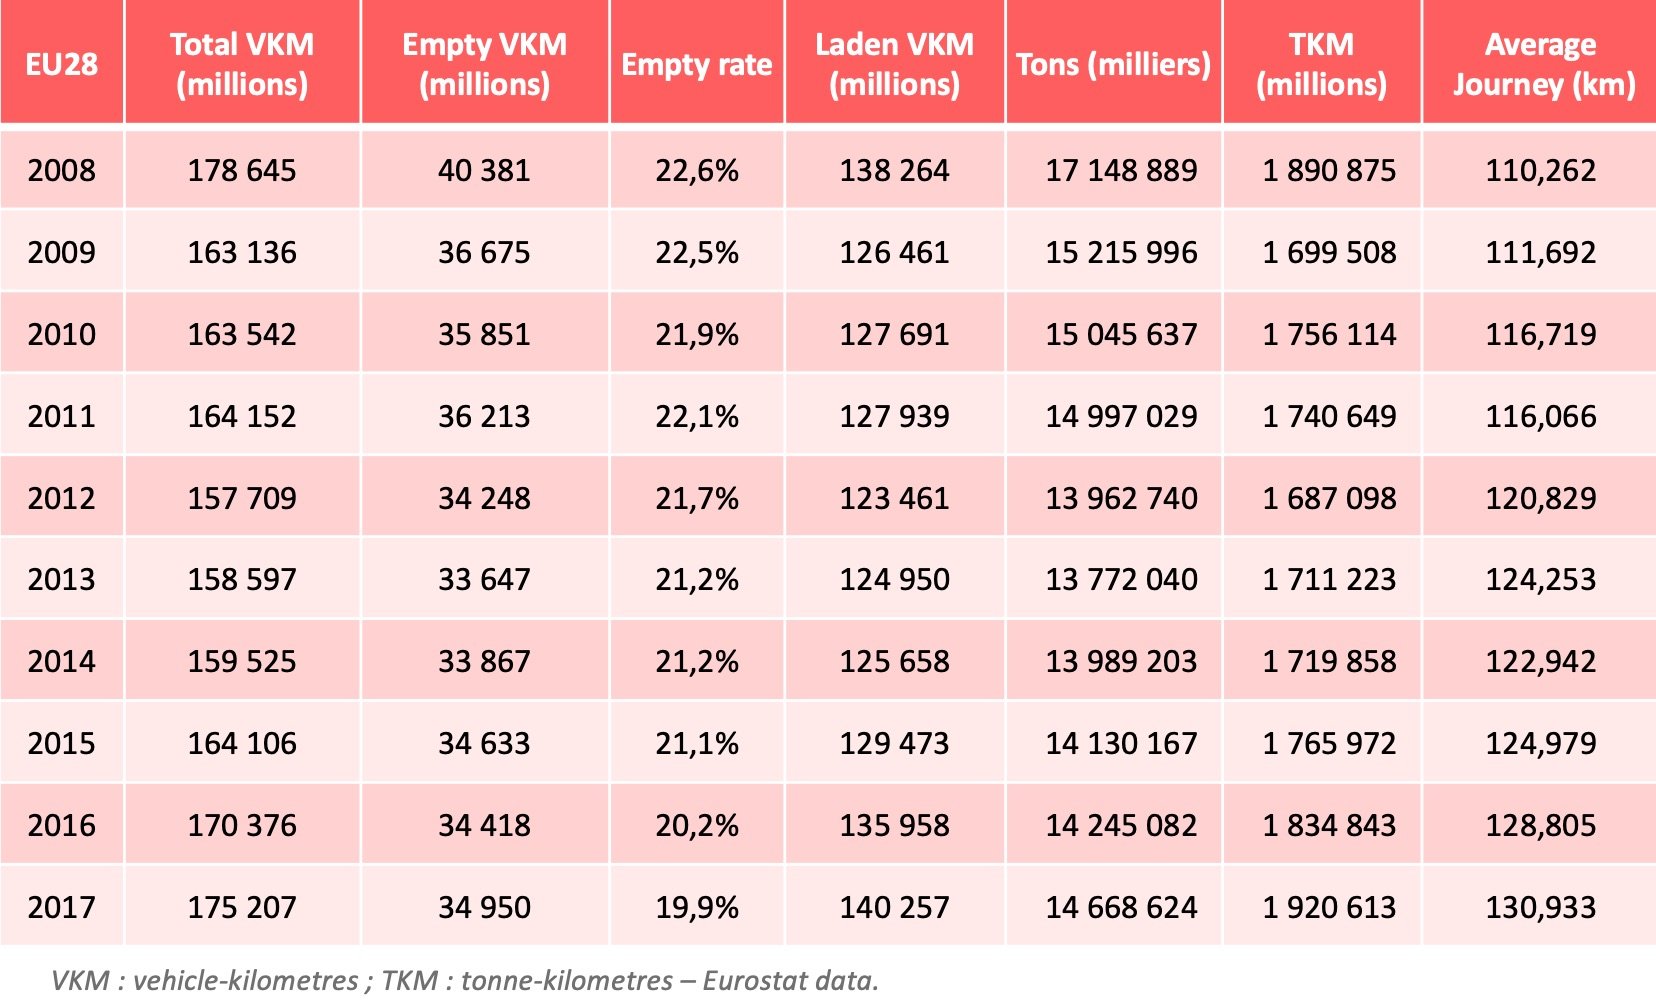
Overall, the number of vehicle-kilometers fell 1.9% between 2008 and 2017 (see table at the end of the article). The graph below shows the respective impacts of four factors on this figure:
- The increase in average transport distance has led to a 9% rise in the number of vehicles.
- This increase is counter-balanced by reductions in total tonnage transported (-7.4%) and kilometers covered without a load (-3.4%).
- Average tonnage per load has a neutral impact since it stayed relatively stable.
A study of purely operational European transport figures over the last 10 years makes apparent three key factors:
- A phenomenal increase in average kilometers covered per trip: +18.7%. In 2017, the average freight transport distance covered was 130.9 km, compared to 110.3 km in 2008.
- A "takeover" of international transport in Europe by the Polish lorry fleet.
- A very significant reduction in kilometers covered without a load: -11.8%. In 2017, the no-load level (kilometers without a load divided by number of kilometers covered) fell below 20% (19.9%) for the first time, compared to 22.6% in 2008.
1 - A marked increase in average distance
Average distance is calculated by dividing tonne-kilometers (TKM) by tonnes. Taking distances covered by category, we see a significant increase journeys over 500 km by contrast to journeys of 150-400 km.
Two possible explanations can be put forward for this:
- On the one hand, by virtue of the enlargement of the European Union, eastern Europe, and Poland particularly, has become the workshop for the whole of Europe. This trend towards industrialisation, as opposed to the trend towards consumption (western Europe), has resulted in an increase in distances covered.
- On the other hand, the supply chain optimisation policies introduced by the major companies are tending to reduce the number of big B2B storage depots and increase their nominal size which in turn increases the distances covered to reach final distribution depots.
Transportation by palette, now the main form of transportation, has increased strongly over the last 10 years.
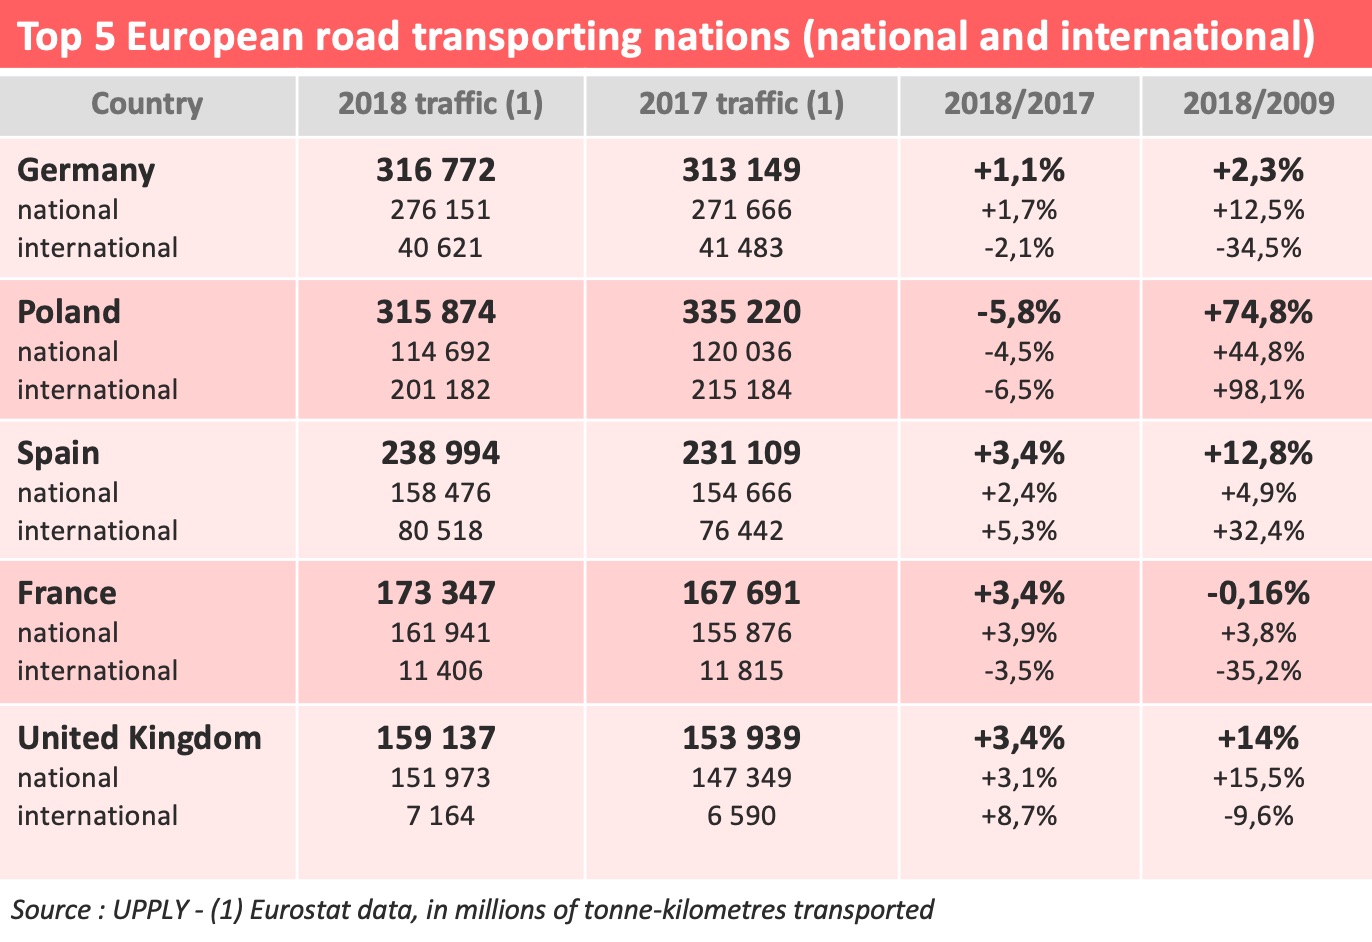
2 - The domination of the Polish lorry fleet
Over 10 years, the Polish lorry fleet has shown huge growth to the point where it is now challenging its German counterpart. It climbed to the top of the table in 2017 but the Germany regained its position by a short head in 2018 with 316.5 million tkm compared with 315.9 million tkm for its neighbour.
The slight setback experienced by Poland in 2018, when traffic fell 5.8%, has in no way reduced the power of its fleet, notably in international traffic. The transport and logistics sector today represents nearly 7% of Poland's GDP and alone produces a surplus of €10 billion for the Polish balance of trade.
The sector is expanding with the growth of Poland's manufacturing output. It is the cutting edge of the Polish economy, which has seen the country's GDP double over the last 25 years.
3 - Environmental satisfaction
The significant fall in kilometers covered without load, which is measured by the "empty rate", corresponds to a real elimination of more than six billion vehicle-kilometers, representing the equivalent of 40,000 lorries per year taken off European roads!
We can be proud of the work carried out by all the transport operations offices which on a daily basis optimise the work of drivers and lorry routes and give clients maximum satisfaction. This operational performance was achieved by all European transporters!
On the other hands, average tonnage per load has been virtually stagnant over the last 10 years (-0.1%). This represents despite all the equivalent of 1,500 less lorries on European road each year.
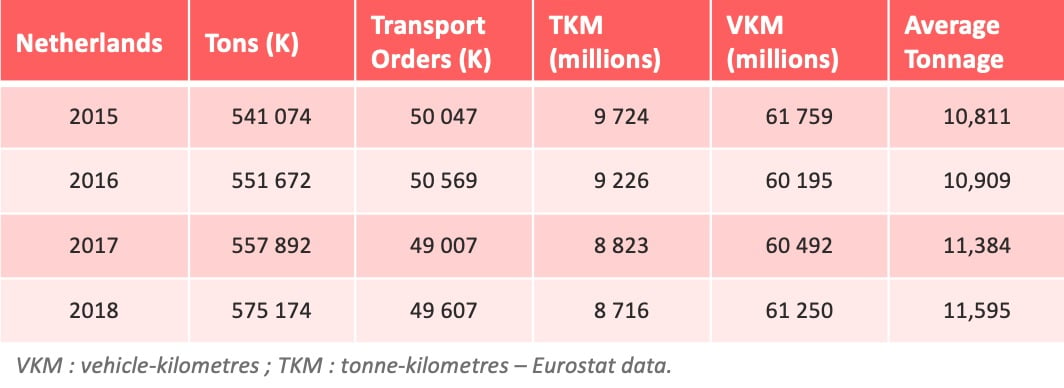
Take the Netherlands as an example. It has taken a series of measures to increase loading levels in tonnes and volume, starting with the authorisation of mega-lorries. Over the last four years, loading levels increased 7%, 70 times more than the European average over the last 10 years! The potential for Europe as a whole is staggering!
The outlook for the next 10 years
Unsurprisingly, there is going to be strong pressure in the social and environmental spheres, while the development of the digital economy should lead to an increase in urban deliveries.
1 - A shortage of drivers in Europe
Already a major issue, the shortage should increase as hundreds of thousands of drivers retire over the next 10 years. The attractiveness of the profession is a key subject.
According to an estimate from recruitment company Grow Up Polska, half of Poland's 700,000 drivers (freight and passenger transport together) are more than 55 years old. Clearly, the Polish transporters' economic modal is going to take a knock and their leadership could be contested.
The technical progress represented by autonomous lorries will not be enough to resolve the problem. Improving social conditions is therefore going to be a major preoccupation, leading to an inevitable increase in prices.
2 - Environmental pressure
Transport is already under heavy pressure from taxation, motorization regulations and its poor public image. Yet the sector is already making great efforts and getting results. Digitalisation will allow kilometers without load to be reduced further by speeding up the exchange of information and better pooling capacity.
East-West distances covered should nevertheless remain at a high level, accounting for half of all tonne-kilometers covered. European regulatory changes on specific corridors should allow a significant reduction in transport's carbon footprint as is demonstrated by the results achieved in the Netherlands. This would take in harmonisation of the 44-tonne limit, the promotion of mega-lorries and platooning.
3 - The challenge of the "final kilometer"
Even if the increase in voyages under 50 km is not yet significant, "final kilometer" delivery is a major preoccupation for the big transport groups and is at the forefront of their development ambitions. It represents added value transportation since it is the last link to the customer.
An estimated 44% of European Union GDP is generated by only 140 major European cities and this proportion is set to increase further over the next 10 years. A treasure trove…attracting fierce competition!
European road transport evolution over ten years