The supply chain diversification is becoming a tangible reality, leading to a profound transformation of logistics chains, not only for finished products but also for intermediate goods.
Supply chain diversification has two major effects. Firstly, it expands trade connections between Western markets and emerging countries. Secondly, it also amplifies the flow of Chinese industrial goods to countries where production activity is being redirected, such as ASEAN, India, Mexico, and the countries of Central and Eastern Europe (CEEC). In 2022, however, China's contribution to Mexico's and ASEAN's imports of intermediate goods was curbed by its Zero Covid policy in force at the time. What is the situation nine months after the country's reopening? This article explores the topic, focusing primarily on China's trade in industrial goods with three destinations: Mexico, ASEAN and the CEECs.
A heterogeneous development
Overall, the latest trade data suggested a varied development across the surveyed country groups in the first semester of 2023. Central and Eastern European countries were the only entity to record a steady increase in the supply of Chinese intermediate goods in value terms and in China's share of the total imports of this type of goods (Figure 1).
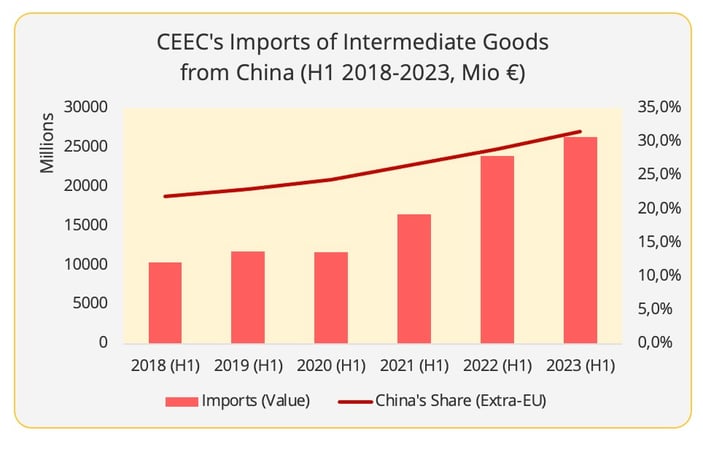
Figure 1 - Data Source: Eurostat[1]
China’s position as a supplier of intermediate goods to Mexico has been slipping since the second half of 2022. Despite some moderate resumption in the second quarter of 2023, it is still well below 2021 and 2020 levels. Mexican imports of Chinese intermediate goods in value terms have also dropped by 10%, a steeper drop than the 3% fall in Mexico’s total imports of intermediate goods in the first seven months of 2023 (Figure 2).
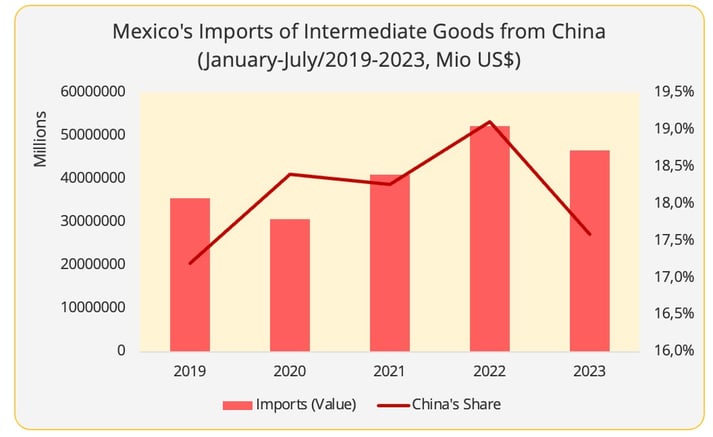
Figure 2 - Data Source: Mexico Statistics Bureau
As no recent intermediate goods data is available for China-ASEAN trade, we are focusing on the trade of machinery goods. This category accounts for around 45% of ASEAN’s total imports from China and consists primarily of intermediate goods for export-oriented production outside of Asia. Six months into 2023, China’s share in this category had still not picked up from the decline seen in 2022. ASEAN's imports of machinery goods from China in value terms have dwindled by 12%, in line with the 12% decrease in ASEAN's total imports from extra-ASEAN countries in this commodity (Figure 3).
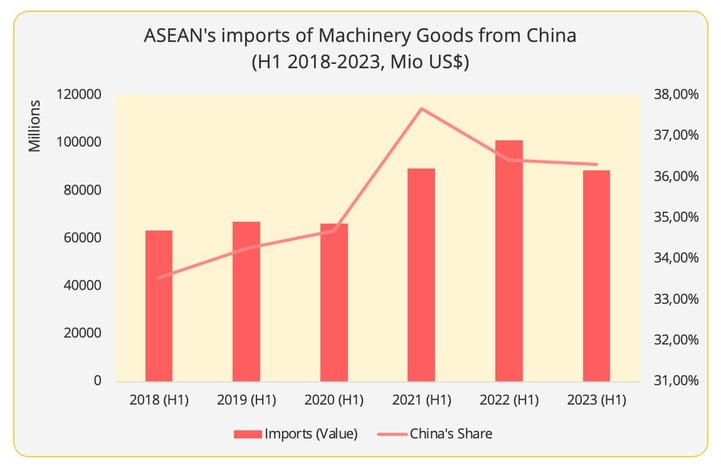
Figure 3 - Data Source: ASEAN Stats
A Tightened Trade with the EU
At the same time, it may come as a surprise that both Mexico and ASEAN have ramped up their sourcing of intermediate goods from the EU.
Specifically, Mexico has increased its sourcing from the EU as well as Brazil, while the imports from its two largest suppliers, the US and China, declined (Figure 4). The EU share in Mexico’s total imports of intermediate goods resumed after falling for five consecutive years, though still below pre-pandemic levels.
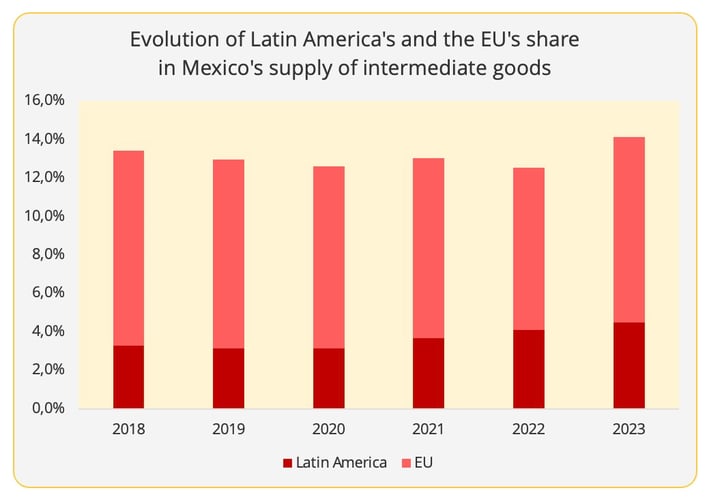
Figure 4 - Mexico Statistics Bureau
ASEAN also experienced an increase in imports of European machinery goods in the first semester of 2023, which was against the overall ASEAN trade performance in this category (Figure 5). The EU has increased its share in ASEAN's total machinery goods imports by more than 1% to above 7% in 2023.
This increase does not concern all ASEAN countries. The rise of the EU (both in value and volume terms) was primarily discernible in Thai, Indonesian, and Singaporean imports. The growth in Indonesia and Thailand could be associated with the automotive industry. Thailand is the region’s automotive manufacturing hub, and Indonesia possesses rich nickel reserves, a critical material for electric vehicle (EV) batteries. The automotive sector was another field with growing European exports to ASEAN during this period.
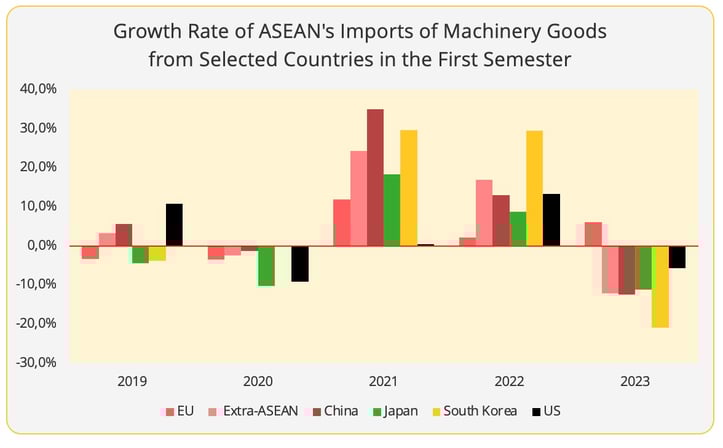
Figure 5 - Data Source: ASEAN Stats
The growth in EU exports to Mexico and ASEAN is not synonymous with an overall recovery in EU trade. EU exports of intermediate goods to non-EU countries remain sluggish in the first half of 2023: the export value and volume decreased by 1% and 7% respectively (Figure 6).
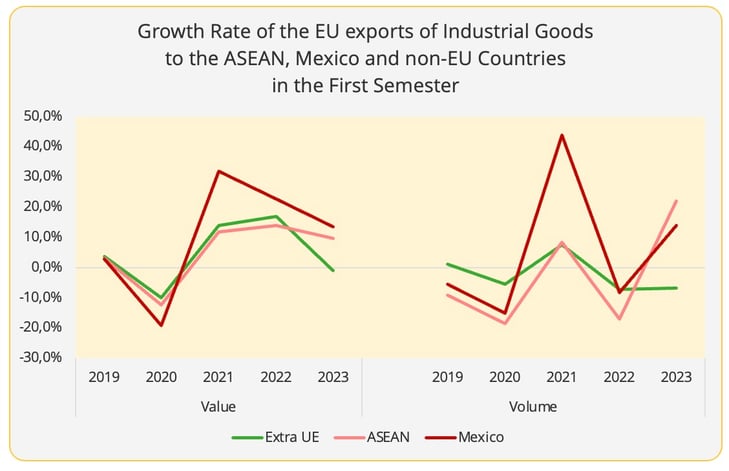
Figure 6 - Data Source: Eurostat
Finally, it should be pointed out that the rise in imports of intermediate goods from the EU did not extend to the CEECs. Intra-EU supply to the CEECs fell in both value and volume terms in the first half of 2023 (Figure 7).
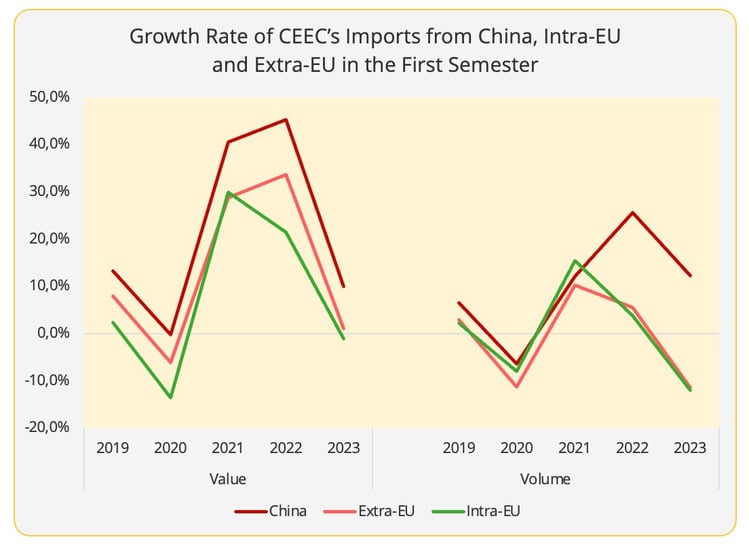
Figure 7 - Data Source: Eurostat
Multi-factorial variations
The growth in European exports of intermediate goods to ASEAN and Mexico does not necessarily mean that the EU is replacing China in these countries, as the trade patterns of China and the EU are quite different. Consequently, the changes in Mexico's and ASEAN's trade with China and the EU are the result of a combination of events. Here we lay out some possible explanations.
- US Regulatory Barriers and Chinese Exports
One primary difference among the three groups surveyed is that Mexico and ASEAN serve more for US supply chain diversification, while the CEE countries are primarily for the EU diversification. This variation can be related to the difference in US and EU regulations on Chinese products.
Mexico and ASEAN are the primary relocation choices for Chinese companies who wish to hedge against the US trade barriers on Chinese goods. Of the two, Mexico is no doubt more sensitive to the changing US regulations on Chinese products, given it is a signatory of the US-Mexico-Canada Free Trade Agreement (USMCA). Furthermore, as part of the USMCA implementation, the Uyghur Forced Labor Prevention Act prohibited a number of machinery goods, materials used in the manufacture of solar panels, and textile products from Chinese entities entering the US. This law came into force in June 2022. A timetable that corresponds to the moment when China's share began to decline (August 2022).
In the future, certain types of Chinese intermediate goods to Mexico could expect to face further challenges, in light of the temporary additional Mexican tariffs (a supplementary 10-25% until 2025) on a wide range of products coming from countries with which Mexico has no free trade agreements. Furthermore, the “non-market economy” clause in the USMCA has significantly restricted the possibility of Mexico to implement a free trade agreement with China.
Likewise, Chinese exports to ASEAN in the solar industry over the next year are anticipated to be exposed to a similar trade barrier. The newly introduced US tariff on Chinese companies that manufacture solar panels in Southeast Asia is to come into effect in June 2024, and tariffs can be as high as 254%.
- Increased Supply of the EU
The dynamism of the EU's relations with Mexico and Southeast Asia could be a manifestation of European companies desire to prioritise the North America and Asian markets, considering the uneven global economic recovery and regulatory changes. This trend is also reflected in the vitality of EU exports of capital goods to both locations, which are used to manufacture products – a sign of production expansion.
European manufacturers are reported to be expanding and building new plants in Mexico to enhance their competitiveness in the US auto market, which is showing robust recovery. European-manufactured autos do not receive equal treatment compared to vehicles assembled in Mexico under the US Inflation Reduction Act. The value of Mexican imports of European intermediate and capital goods has increased by 11% and 15%, respectively, according to the data from the Mexican Statistics Bureau.
Trade links could be further strengthened by intensified European investment in the Mexican manufacturing sector in 2023, which has already surpassed the total value in 2022. Furthermore, as the EU has a free trade agreement with Mexico, the newly introduced tariff scheme in Mexico could make sourcing from the EU more attractive.
Similarly, the Indo-Pacific region's political importance and economic potential spurred rising European investment flows to the Southeast Asian manufacturing sector. According to the ASEAN Stats, the EU was the second largest external investor in ASEAN in 2021 and 2022, following the US.
In contrast, persistently higher energy costs than before the pandemic and the contraction in demand are creating a less favourable context for sourcing or developing production in Europe. Some sectors in Europe, such as the chemical industry and the automotive sector, are facing weak demand and increasing costs, so in an effort to cut these costs they are turning to downsizing, while expanding in other emerging markets, such as Southeast Asia, Latin America, or China.
In general, when supply chain diversification is discussed, the European Union is automatically seen as an entity looking for diversification options, rather than as a region that could itself constitute a diversification option (apart from cases of friend-shoring or reshoring to the country of origin). Recent developments seem to indicate that it may also serve a dual purpose. However, we'll have to wait and see whether current observations are confirmed before we will know whether this is a lasting trend.
[1] The intermediate goods here refer to products under code 210, 220, 420 and 540 in the BEC V4 categorization. Without further explanation, all the EU related intermediate goods data are compiled based on these four codes.