The World Bank has published the 7th edition of its report “Connecting to Compete”, which presents the logistics performance index of 139 countries. Summary in 5 figures of this first post-Covid edition.
Since 2007, the World Bank has published a logistics performance index by country, based on six evaluation criteria[1], as part of its report "Connecting to Compete". The 2023 edition was enhanced by the analysis of shipment tracking data in the different modes of transport, which complements the results of the traditional survey conducted among transport and logistics professionals (LPI).
The six components of the Logistics Performance Index [1] are assessed at national level on a 5-point scale, which is then used to obtain an overall score also based on this 0 to 5 scale.
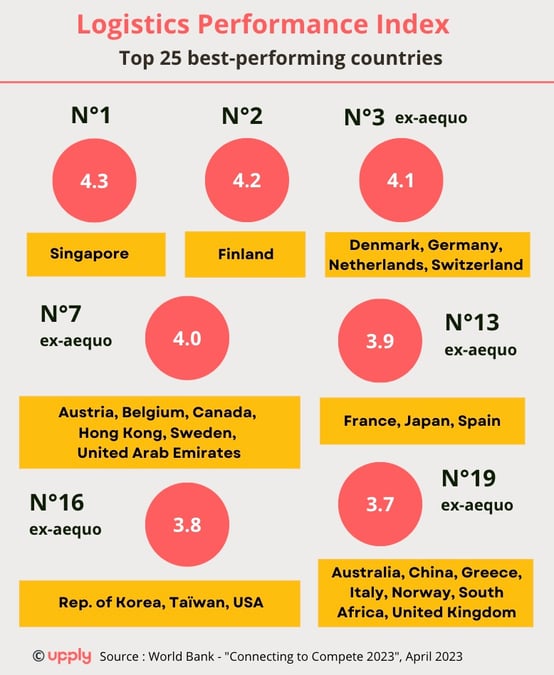
This is the number of European countries that are in the global top 10 in terms of logistics performance. A stable figure compared to the previous edition, published in 2018. The United Kingdom drops from the Top 10, plummeting from 9th to 19th place, while Switzerland enters, climbing from 13th to 3rd position. Germany lost its first place on the podium to Singapore, the leader with an overall index of 4.3. Singapore was in 7th place in 2018.
Canada entered the Top 10 with a particularly spectacular performance as it ranked 20th in 2018. The 12 countries with a logistics performance index greater than or equal to 4.0 out of 5.0 all correspond to high-income economies.
This is the position occupied by France in this world ranking. The country climbed three places compared to 2018 and thus came close to its best ranking, namely a 12th place obtained in 2012, before falling back to 16th position in 2016 and 2018.
This is the average number of days between the entry of a container into the port of export and the exit from the port of destination, on all potential trade routes. About 60 percent of the time is spent at sea, but "the biggest delays occur when containers are held up at the origin or destination," at ports, airports or logistics zones, the World Bank said. Regarding the time spent in ports, the report notes that industrialised economies are not necessarily more efficient, which is partly explained by the congestion of supply chains during the period of post-Covid economic recovery. The average dwell time of a container in a port between May and October 2022 was 3 days for India and Singapore, 4 days for the United Arab Emirates and South Africa, but 7 days for the United States and 10 days for Germany.
This is the number of days beyond which the time spent at an airport by an air cargo shipment is considered excessive. The report finds similarities between maritime and air transport, as it is often the same countries that show excessive dwell times in one mode or the other, "points to serious structural issues with logistics performance."
This is the percentage of shippers who "often" or "almost always" request logistics solutions that allow for a reduction of the carbon footprint of supply chains when exporting to countries in the top two logistics performance quintiles. These environmentally sustainable options include switching to less carbon-intensive modes of freight transport, more energy-efficient warehousing or better use of capacity. The World Bank notes that the growing number of global and national commitments to reduce logistics-related greenhouse gas emissions is having a tangible impact. However, the impact varies from one area to another. The percentage of shippers who “often” or “almost always” request logistics solutions that allow for a reduction of the carbon footprint is just over 20% when exporting to countries in the mid-performance quintile and well below 10% when exporting to countries in the two lowest-performance quintiles.
[1] The World Bank Logistics Performance Index (LPI) analyses countries through six components:
- The efficiency of customs and border management clearance.
- The quality of trade and transport infrastructure.
- The ease of arranging competitively priced shipments
- The competence and quality of logistics services, trucking, forwarding, and customs brokerage.
- The ability to track and trace consignments.
- The frequency with which shipments reach consignees within scheduled or expected delivery times.
The survey of logistics professionals for the 2023 edition was conducted from September 6 to November 5, 2022.