While almost every week brings a new episode in the trade war between China and the US, it is interesting to examine the exclusion lists used to allow certain products to be exempted from the additional tariffs.
This month of August was a roller coaster ride full of announcements:
As September starts, some of the newly imposed tariffs on both Chinese and U.S products are now effective. The U.S. goods entering the Chinese market, which are mostly agricultural and food products, represent about a third of the $75 billion tariff list, and are now facing a 5% to 10% additional tariff. With the newly imposed $300 billion worth of U.S tariff on Chinese products, nearly all Chinese products are now facing various levels of tariff. While discussions are ongoing about the latest tariff lists, we think it’s important to also analyze another strategic document for business planning: the exclusion lists.
Both sides have issued (and will publish) exclusion lists to allow certain products in the tariff lists to be exempted from the new tariff policy. In this article, we focus on the exclusion lists published by U.S, as we want to shed light on the U.S government’s logic in generating/modifying the tariff list, thereby helping us get a better idea of the overall picture of the on-going trade war between these two countries.
Unpacking the lists
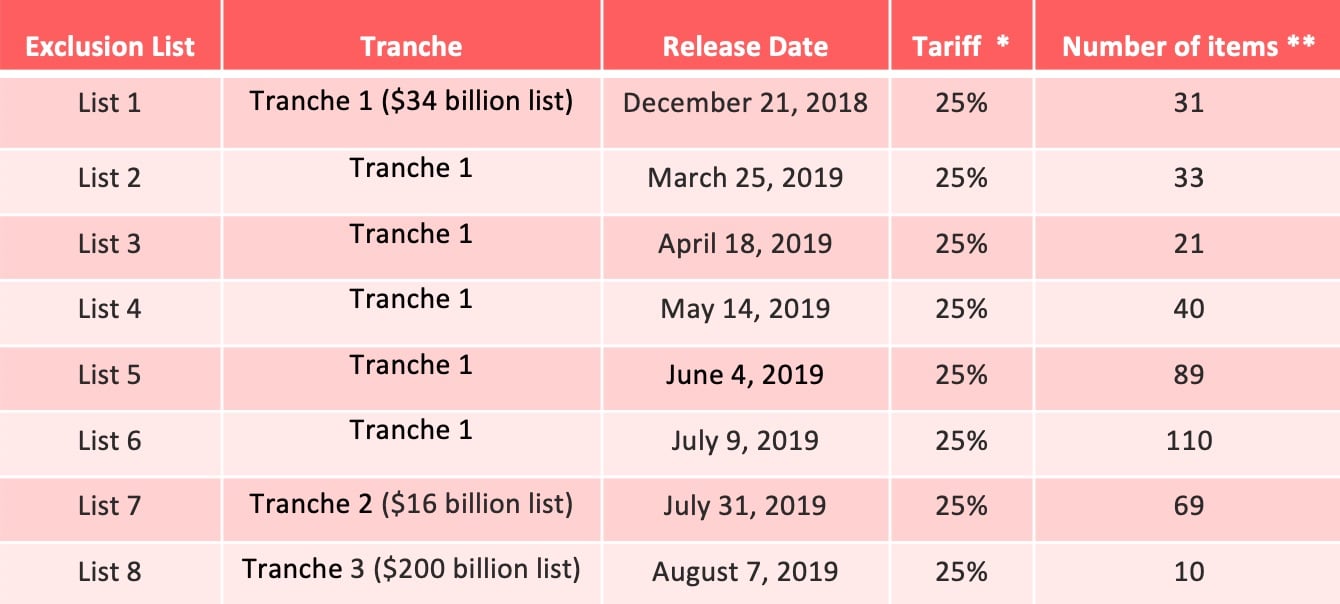
The U.S trade representative has issued eight exclusion lists for the first three Tranches, which allow certain products to be exempted from additional tariff. The exclusions became applicable on July 6, 2018 (tranche 1), August 23, 2018 (tranche 2) and September 24, 2018 (tranche 3) and are valid for one year after their publication in the Federal Registry. Unfortunately, the tranche 4 exclusions are not applicable yet, although they were supposed to start in September.
Figure 1- *After Oct. 1st it will be 30%; ** Replicated HS codes. Data source: USTR
For tariff purposes, products are classified in large categories each defined by a 2-digit code, which are then divided in smaller categories identified by 10-digit codes. On the face of it, it seems the exclusions cover the larger product categories. With the exception of three HS codes used for woven and steel products, all the excluded products are part of the machinery (84), electronic machinery (85), plastics (29), or optical products (90) categories, which are also the main categories of Chinese exports to the United States. But this does not mean most Chinese exports will be exempted from additional tariff. Even though they target the largest categories, only a small percentage of imports will benefit from the exclusion. Taken all together, the eight exclusion lists cover 221 10-digit HS codes, accounting for 3% of all US imports from China in 2018. Taken individually, none of the products in the exclusion lists account for more than 1% of all US imports from China, with the maximum being 0.24%.
Selection Criteria
The USTR laid out three criteria to determine whether or not to grant the exclusion to a good:
- Whether the particular product is available only from China.
- Whether imposing additional taxes on the product would cause severe economic harm to the requestor or other U.S. interests.
- Whether the particular product is strategically important to China, or related to “Made in China 2025” or another Chinese industrial programs.
The first two criteria help determine whether a product should be excluded from the tariff list, and the third gives a reason for an item not to be excluded. “Made in China 2025” (MIC 2025), a document published in 2015, is a ten-year plan to develop the Chinese manufacturing industry. In recent years, China has intentionally downplayed the “MIC 2025” plan. Yet, it remains a concern for the U.S, who sees it as a threat to its high-tech manufacturing industry. As such, products from the critical fields, in "MIC 2025", such as information technology, robot, etc. were unlikely to get an exclusion.
These three criteria provide general information on the decision-making process used to develop the exclusion lists. Nonetheless, they remain somewhat vague. To better understand the selection criteria, we must analyze trade data for the products in the exclusion lists.
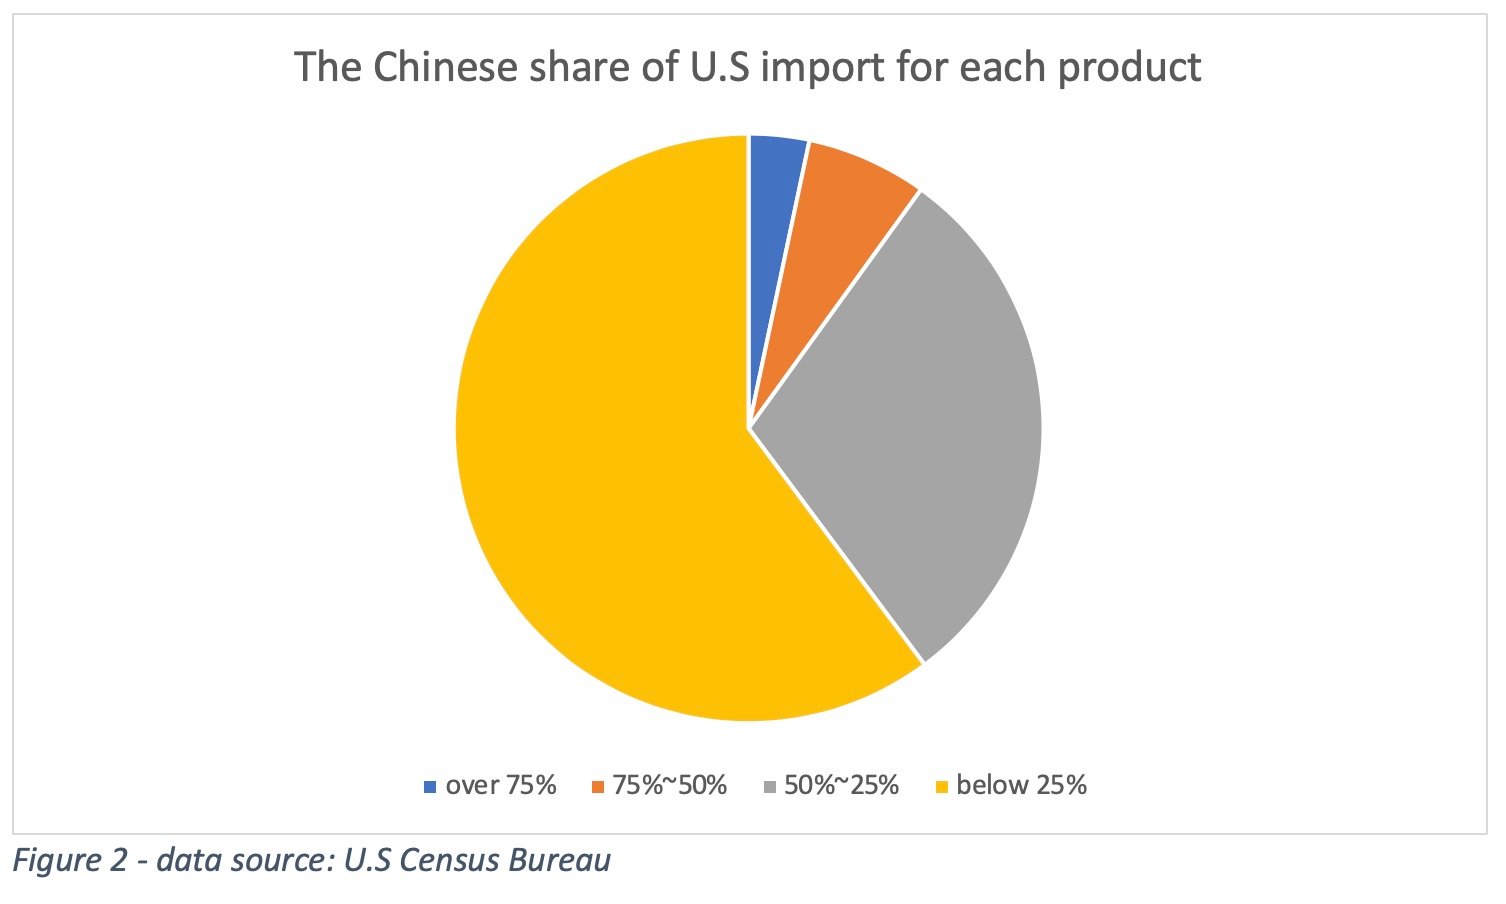
We start with the Chinese share of U.S imports in the exclusion lists, which feeds into the first criteria: the availability of alternative suppliers. The Chinese share of U.S. imports for these goods actually varies. Only 7 items in the exclusion lists have a 75% share or more of Chinese suppliers. For around 10% of the products in the exclusion lists, 50% of the total import comes from China. And for about 60% of the goods, China supplies less than 25% of the total imports to the U.S.
This variation leads to the next question: why did these products, for which China serves as a minor supplier, also get granted exclusion, considering alternative suppliers exist?
There are two possible explanations. First, although the Chinese share of import is small, those products specified in the exclusion lists are only available from Chinese suppliers. As mentioned above, the exclusion lists do not grant exclusion to all the products under one HS code (10 digits), but rather to specific products under the code. This stems from the first criteria.
But this may also come from the second criteria: the tariff’s economic damage to the requestor or another U.S interest. To harness the “other US interest”, we focused on products where Chinese share is below 25% to see whether certain patterns can be identified. For these products, most of them have European, Japanese, and Mexican primary exporters. Particularly, more than half of these products are mostly exported from the EU. From there, we may generate some ideas of what “other U.S interests” can be:
-
The competitiveness of U.S products in the global market: the U.S. may grant exclusion to Chinese products when products from alternative suppliers are more expensive, which may add to the overall cost of U.S products, resulting in a negative impact on the competitiveness of U.S products in the market. For instance, the US’s import one specific type of Hydraulic motors (HS code 8412210045), which mostly comes from European manufacturers has dropped 28% in volume, while the importing value increased 21% in 2018, as compared with 2017, according to the U.S Census Bureau.
-
Maintaining bargaining power with other major trade partners, with whom the U.S is negotiating trade deals. The U.S might be trying to strategically keep the balance of the trade with its other main trading partners, like the EU and Japan, or maintain control with countries with whom it has other standing issues, like the U.S-Mexico border issue.
Disruption to the Supply Chain
The exclusion lists show how the U.S is seeking balance between its bargaining power at the negotiating table, and its dependency on suppliers from China and other countries. While it tries to reduce the disruption to the supply chain, it seems the U.S will still get hurt as the new rules become applicable. This will be particularly true after December 15, when Chinese tariffs on a wide range of machinery goods and automobile products will become effective. The Chinese government issued two tariff lists. List 1 covers mainly food and chemical products (effective starting on September 1st). The second list includes machinery products and automobiles, which becomes applicable on December 15. Taking the automobile sector as an example, it will face 5% to 25% additional tariff imposed by China starting on December 15.
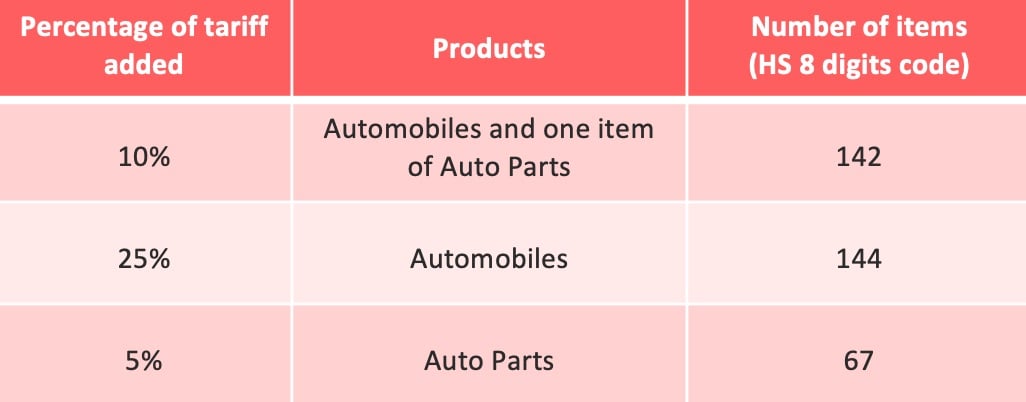
Concerning this industry, the latest Chinese retaliation covers 353 items (HS 8 digits code) under section 87, the section for automobiles and auto parts, representing a significant proportion of the total U.S exports of auto related goods to China, both value wise and volume wise (1). While this might be an opportunity for some of the European and Japanese automobile manufacturers to expand their market shares in China, German automobile manufacturers will also feel some pressure from the Chinese tariff imposed on U.S-made cars, which also include German cars manufactured in U.S factories.
Let’s hope for the best but prepare for the worst...
(1) Since Chinese import data is unavailable, this information comes from the U.S Census data (HS code 6 digits). This proportion assessment (around 80~90%) might turn out to be slightly higher than the actual number)