During the summer, the demand in the US for Chinese goods was very strong. Does this mean that the trade war is mainly a verbal one? Certainly not. The diversification in suppliers is a reality, especially in high added-value sectors.
The record high transpacific eastbound ocean freight rate, due to the tight shipping capacity and massive demand for Chinese goods in the US, seems to be totally at odds in every way with the tensions between the 2 countries. According to China Customs, in August, Chinese exports to the US showed a year-on-year increase of 20%, which is a rebound to 2017’s pre-trade-war levels. What kind of goods are leading imports from China? Do we see any trade diversification of imports from other countries? This article will try to unravel the recent developments in China-US trade based on the latest data.
Where is traffic flowing to?
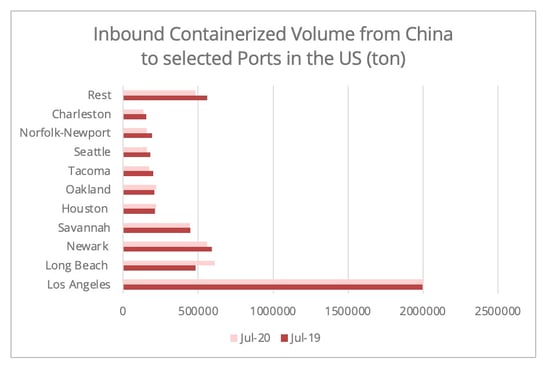
The biggest increase is seen in West-Coast Ports, the gateway for Asian goods, which is the reason for the all-time high in transpacific freight rates to the US. Among the top ten ports that import Chinese goods, the only one to show an increase in July that is not situated on the western seaboard is the Port of Houston (Figure 1).
Notably, this August has been the busiest month in the history of both the Port of Long Beach and the Port of Los Angeles, with a year-on-year growth in imports of 13% and 18% respectively. Interestingly, despite the ports of Los Angeles and Long Beach being located side-by-side, the growth of the inbound flow of the Port of Los Angeles came a bit later than its neighbor. While Long Beach had already seen a surge in July, it was not until August that the Port of Los Angeles saw its first positive growth of 2020. The three-week forecast published by the Port of Los Angeles, predicts that the two-digit increase will continue to the second week of October.
Figure 1 - Data source: US Census Bureau
As many analyses suggest, the surge is primarily driven by the high e-commerce activity in the US due to the pandemic. Specifically, the increase in containerized shipping volume comes from two categories of goods: personal protective equipment and household goods. For the latter category, demand was mainly for home physical exercise equipment, kitchenware, office supplies, and major appliances, such as refrigerators and washing machines (figure 3). The extended time that people were spending at home due to the pandemic and the coming summer vacation season had triggered a growing need for home appliances, even though many are subject to an additional tariff of between 7.5% and 25%. The shipping volume of furniture declined, but despite this it still consisted of the largest part of containerized shipping volume from China to the US.
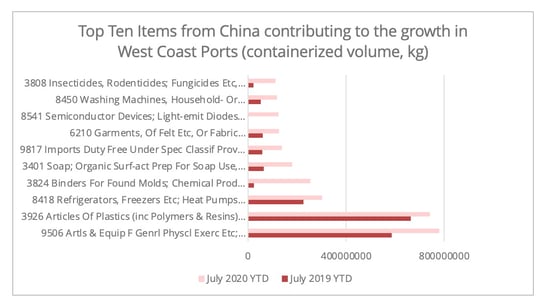
Figure 2 - Data source: US Census Bureau (based on the Port Data of the ports of Los Angeles and Long Beach.
The transpacific westbound shipping to the Chinese market is also showing signs of recovery since June. In August, the value of Chinese imports from the US showed a 1.8% increase (based on the data provided by Chinese General Administration of Customs). The growth was driven mainly by Chinese purchases of agricultural products, which is also at the core of the China-US phase-one trade deal. As of September, Chinese purchases of soybean for 2020 have already surpassed the figure for the whole of 2019. According to the US Department of Agriculture forecast published this August, demand for grain for animal feed is expected to remain strong as China attempts to restore its pig herds. Nonetheless, this move also generated a lowered forecast on the Chinese purchase of US livestock and meat. However, China has put in place a temporary ban on German pork imports, which could generate further Chinese demand to US suppliers.
Not the full picture
Of course, the surge in China-US trade during the summer period comprises only part of the picture. Despite the significant increase in imports during July and August, China-US trade is still under the shadow of bilateral tensions and the pandemic.
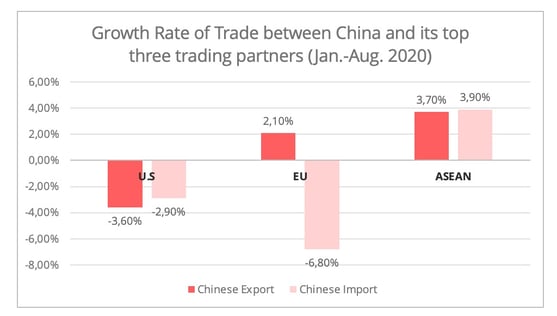
- Firstly, for the period of January to August, total China-US trade dwindled by 3.5%, with Chinese imports from the US declining by 2.9%, and exports falling by 3.6%. According to Chinese Customs, among its top three trading partners, the ASEAN, the EU, and the US, trade with the US is the only one experiencing a decrease in both exports and imports in the past eight months (figure 2). Despite the recent spike, containerized shipping volume (kg) of goods from China from January to July to the ports of Los Angeles and Long Beach suffered a 15% and 14% decrease, respectively.
Figure 3 - Data source: General Administration of Chinese Customs, PRC
- Secondly, the tension is more perceptible in tech sectors such as the telecommunication and informatics industry. Yet, some of these products can be less volume significant. The tension in these sectors has also been a catalyst for the diversification of suppliers. If we consider China’s largest export category to the US (in value) as an example, cellphone related products (HS code 8517), we notice that in 2017, China supplied 64% of goods in this category on the US market. Two years later, in 2019, the share was down to 59%, while ASEAN's share jumped from 13% to 20% and has further increased to 22% in the past seven months.
Fragmented China-US trade
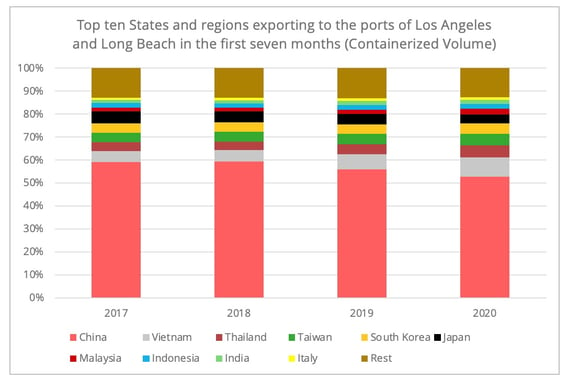
In the long run, Chinese trade with the US will become increasingly fragmented, with some sectors retaining a tight connection, and some seeing more diversion to Southeast Asia, India, and Mexico. A tight connection may be more likely in some low added-value sectors, such as plastic consumer products, while diversification may occur in high added-value sectors such as the telecommunications and automotive industries. Diversification in suppliers has also resulted in a lowered share for China of inbound goods to ports on the west coast of the US (figure 4).
Figure 4 - Data source: US Census Bureau
Furthermore, this diversification will also bring a new dynamic to the utilization of shipping routes. A recent article in the Wall Street Journal reported that the diversification of suppliers and the spike in freight rates to the West Coast have increased the trend for shipment of East Asian goods to East Coast ports. Diversification in Southeast Asia allows shippers to make a transshipment call in Europe then on to the US East Coast. This tendency can be observed in the Port of Newark in New Jersey. In the first seven months of 2020, goods shipped from Southeast Asian countries to the Port of Newark increased by 2% compared to the pre-trade-war levels of 2017.
Following warnings from Chinese Ministry of Transport and the US Federal Maritime Commission, the current transpacific freight rate situation may be subject to change, since some carriers are now injecting more capacity into the market. However, there is no turning back from the fragmentation of China-US trade.