The EU and the United States have expressed their desire to strengthen their respective strategic autonomy, based in particular on the diversification of supply chains. This is a complex ambition to implement.
The global pandemic has spurred the discussion of supply chain diversification, especially "China Plus One." Did manufacturers talk the talk and walk the walk? This article attempts to take a preliminary comparative view of the US and the EU supply chain diversification over the past two years.
This article will look at two types of supply chain diversification activities: offshoring diversification to other countries, such as the ASEAN and India, and nearshoring to regions in close proximity to the market, such as Turkey, Central and Eastern European countries[1] (CEE), and North Africa for the EU, and Mexico for the US. We focus on intermediate goods trade, an ideal indicator to measure the value chain integration. A higher share of intermediate goods imported from China is likely to indicate a higher reliance on Chinese supply for domestic manufacturing activities and vice versa.
Different trajectories for the EU and the US
Although the EU and the US both announced their intention to reduce their reliance on Chinese supply, the trade data tells two differing stories. EU imports of Chinese intermediate goods have discernibly increased over the years (Figure 1). On the contrary, the US demand for Chinese intermediate goods has declined since 2019 (Figure 2), except for the automotive industry, whose imports from China have rebounded following an initial decline.
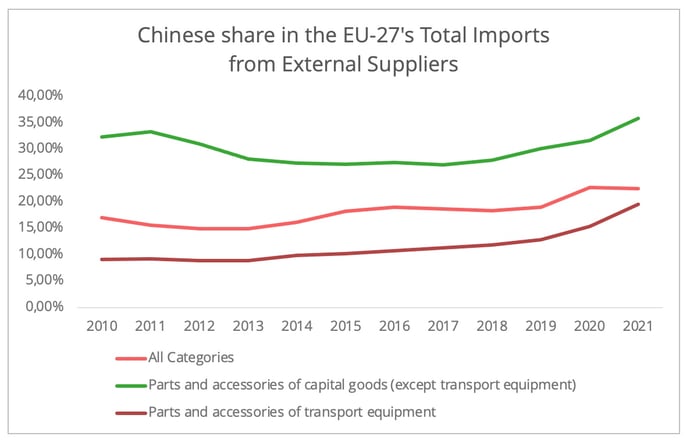
Figure 1- Data Source: Eurostat
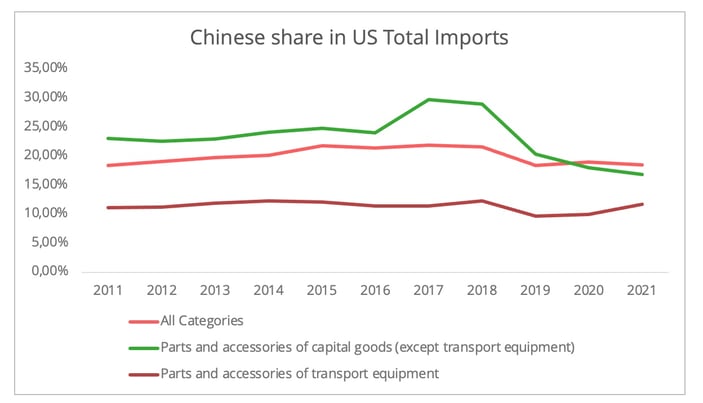
Figure 2- Data Source: UN Comtrade
Is such a pattern applicable to all industries? To answer this question, we will study the Sino-EU and Sino-US intermediate products trade in five different sectors: machinery goods, textile, furniture, transport equipment, and pharmaceutical industries[2].
We have selected the first three because China has long been a dominant supplier to the US and the EU in these three industries. Transport equipment and pharmaceuticals are sectors in which the EU and the US are keen to re-establish strategic autonomy. These five industries accounted for 75% of EU and 70% of US imports from China in 2021. Due to data availability, EU data is aggregated from only the top ten EU importers of Chinese goods (EU-10[3]), which nevertheless accounted for 87% of total EU imports from China by value in 2021 (Figure 3).
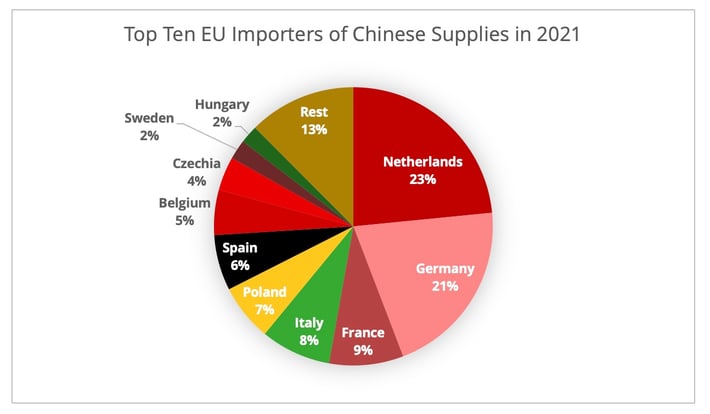
Figure 3- Data Source: Eurostat
An Industry-based Comparison
Nearshoring and offshoring supply chain diversification has effectively occurred in the EU and the US.
- Nearshoring can be found in the textile and automotive industries. The record cost of freight has been the cause attributing to the nearshoring trend of the textile industry.
- For offshoring diversification, the ASEAN and Taiwan are the two popular solutions for machinery goods (Table 1). For the moment, only a modest quantity of imports has been diverted to Indian suppliers. However, the massive foreign investment in mobile phone manufacturing industries in India could lead to a rise in its share in telecommunication machinery trade activities.
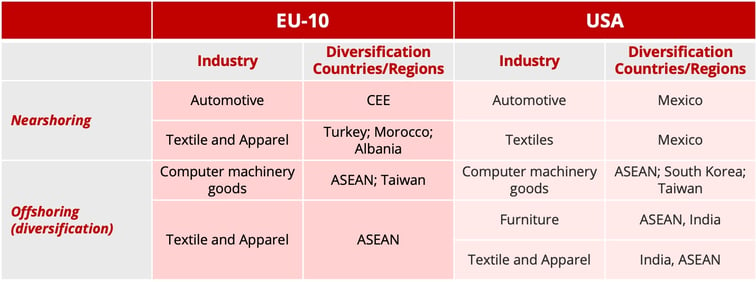
Table 1- A comparison of trade diversification between the EU and the US.
Apart from these similarities, the divergence in trajectory that we mentioned earlier between the EU and the US can be seen in the textile and machinery manufacturing industries (Figures 4 and 5). In the case of the EU, the growing share of imports from countries such as ASEAN has not weakened demand for Chinese products. Conversely, in the case of the US, more dynamic trade activity with alternative suppliers in these two industrial sectors has led to an erosion of China's share.
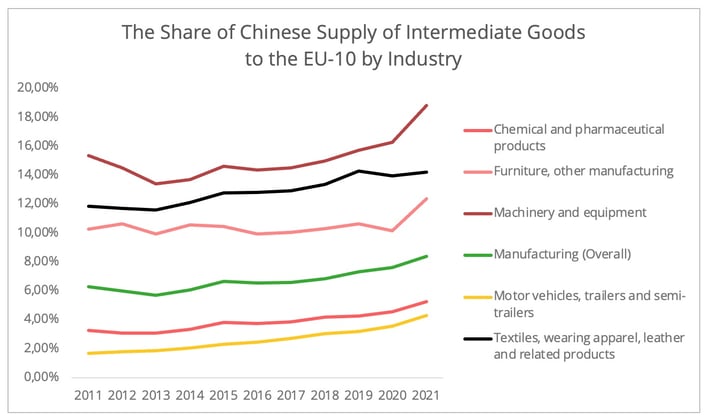
Figure 4- Data Source: OECD End-Use Data[4]
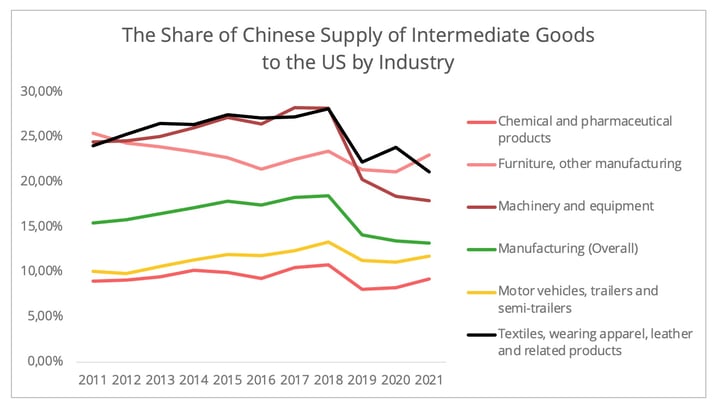
Figure 5- Data Source: OECD End-Use Data
Such a difference can be best illustrated by computer machinery goods. In the US case, the Chinese share has drastically plummeted since 2019, from 30% in 2018 to 12% in 2021. The declining Chinese share was compensated by burgeoning supply from the ASEAN, Taiwan, and South Korea, the current top three exporters of intermediate computer machinery goods to the US market (Figure 6). In contrast, while the EU also increased imports from the ASEAN and Taiwan, the Chinese share grew steadily over the past five years (Figure 7). Meanwhile, supply from within the EU and supply from Japan, Korea, and the UK dropped.
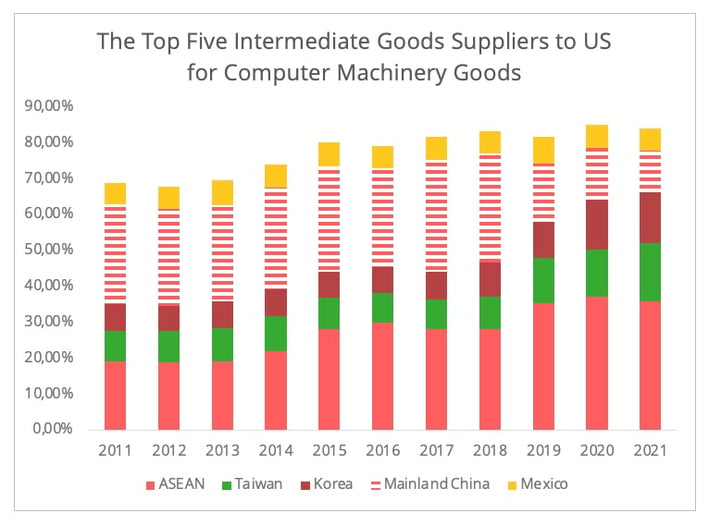
Figure 6- Data Source: OECD End-Use Data
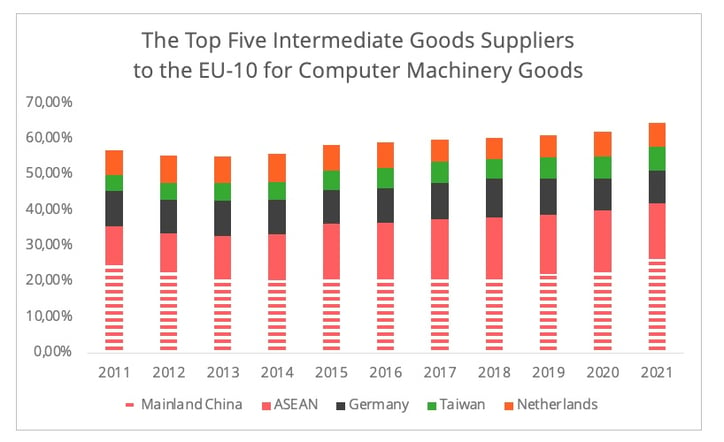
Figure 7- Data Source: OECD End-Use Data
- Diversification in Strategic Sectors
Automotive and pharmaceutical industries[5] are the two sectors where the EU and the US share similar intermediate goods trade patterns with China. The Chinese share in both markets remains relatively modest but is showing steady growth, especially over the past two years.
- In the case of the automotive industry, China has emerged as the largest external supplier of automotive intermediate goods to the EU market and the second-largest supplier to the US market, following Mexico. However, the strict lockdown decided last spring in Shanghai, China's automotive manufacturing hub, may accelerate the reconfiguration of the supply chain in this industry.
- In the case of chemical and pharmaceutical goods, the pandemic has considerably accelerated Chinese exports to the EU and the US. According to Eurostat, the EU imports of organic chemical products from China have jumped by 268% in the first four months of 2022 compared to 2019, predominantly driven by surging German demand. The Chinese export of pharmaceutical goods also grew by 151%. On the other hand the value of Chinese exports to the US of organic chemical goods and pharmaceutical products in the first five months has increased by 71% and 521%, respectively in comparison to 2019, whereas the total US imports of these two categories only increased by 32% and 30% each[6].
- Trade Connections between China and the Diversification Options
The above findings suggest a tangible emergence of a supply chain diversification strategy in some industries. This raises the question of the level of trade connections between China and potential diversification countries in the intermediate goods sector. Indeed, a close connection could reduce the benefits of diversification in improving supply chain resilience. This ripple effect was well observed, for example, in the recent Covid surge in China, which not only curbed Chinese manufacturing activities but also slowed production in other Asian countries.
The growing intra-Asian connectivity has amplified trade connections between China and ASEAN. Let us take Vietnam as an example as it is one of the most promising diversification options, especially for machinery goods and textile. Compared to 2019, the EU and the US imports from Vietnam in 2021 increased by 12% and 57%, respectively (Figure 8). The intermediate goods trade connection between China and Vietnam in the machinery and textile industries has also spiked in the last five years. More than half of Vietnam's imported machinery and textile fabrics were from China.
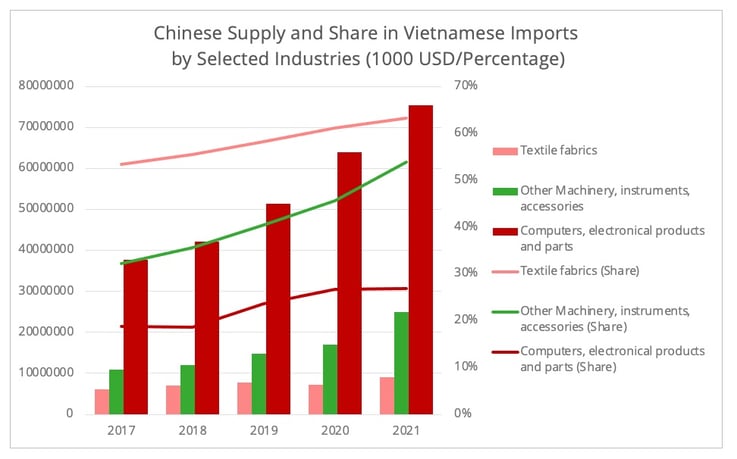
Figure 8- Data Source: General Statistics Office of Vietnam[7]
This does not only apply to countries geographically close to China. It also concerns the nearshoring options such as Turkey, Mexico, and CEE countries. For instance, the Chinese share in Mexico’s total imports of automotive intermediate goods has jumped from 7.5% in 2019 to 10.5% in 2021. The increase occurred despite the US-Mexico-Canada Agreement having set the threshold for the rules of origins as high as 75% to stimulate a regional supply chain.
One outlier is the Turkish textile manufacturing industry. Turkey has increased sourcing from regional suppliers in Eurasia and North Africa in recent years, though China remains its largest textile intermediate goods supplier. This process had already begun before the pandemic.
Understanding the differences in the US-EU trajectories
Overall, therefore, the statistics indicate that the EU and the US have adopted two distinct models of supply chain diversification, even if the policy goals of reducing their dependence on China are similar. How can these differences be explained?
One possibility is that the patterns we observed here are more associated with incidents or trends that took place before the pandemic. For example, the declining US demand for Chinese intermediate goods can perhaps better be explained by the China-US trade war, since the change happened in 2019, a pre-pandemic period. However, the impact is more salient in less technologically intensive sectors. For industries with a complex global supply chain, such as the automotive industry, the Chinese share continues to grow regardless of the US tariff and non-tariff trade barriers.
Furthermore, the EU and the US hold different policy approaches to China, though the positions are also converging. There is a nuanced difference between the EU and the US regarding the purpose of the US-EU Trade and Technology Council. The EU places more emphasis on transatlantic cooperation, whereas competing with China via such an institutional framework is crucial for the US. However, the EU's hardened position towards China and also the industrial programs to boost intra-EU manufacturing capability may bring changes to the current EU-China trade patterns on intermediate goods.
Therefore, the real repercussions of the pandemic on global supply chain reconfiguration may emerge gradually in the upcoming years. Furthermore, the asymmetrical recovery from the pandemic between Asia and the West in the past two years also temporarily increased demand from China. This situation could gradually change with developments in the social and economic conditions. For instance, the surge in Chinese supply in the furniture industry in the past two years could be a joint outcome of dynamic demand for home décor and the relatively good recovery in Chinese manufacturing capacity.
Outlook
Looking forward, will we see more continuity or changes in the current patterns? Various events likely to take place in the second half of 2022 could affect the supply chain diversification.
For the US, the potential partial lifting of US tariffs on Chinese goods could generate some resurgence in Chinese exports to the US in some sectors. Nonetheless, the tariffs are more likely to be removed for some finished consumer goods rather than for intermediate industrial goods. This implies a limited impact on the development of the current Sino-US intermediate goods trade pattern. Furthermore, Biden's decision to grant a two-year tariff waiver on solar panels from four ASEAN countries may underpin the US trade diversion from China to Southeast Asia. However, there are concerns from the US manufacturers that Chinese manufacturers of cells and panels are taking advantage of the waiver to dodge tariffs on entry to the US. This has resulted in an investigation led by the US Ministry of Commerce.
In the EU case, the continued domestic energy crisis puts a big question mark on whether the EU has prepared itself sufficiently to support reshoring or nearshoring to the CEE countries. This is particularly relevant, as forming a pan-European supply chain is the key element to enhancing strategic autonomy in critical sectors such as semiconductor and EV battery manufacturing. Will the energy crisis result in the EU becoming more dependent on Asian or US supply of strategic goods? The upcoming winter months could be the testing ground for the resilience of the EU.
Finally, major political events such as the US midterm elections and the Party Congress in China in the second semester of 2022 could also shape foreign trade and industrial policies. The interaction of these events may have an enduring impact on the global supply chain reconfiguration.
[1] Based on OECD definition, the Central and Eastern European Countries refer to Poland, Hungary, Romania, Bulgaria, Czechia, Slovakia, Slovenia, Latvia, and Estonia.
[2] Without further specification, the data in this paper are sourced from the OECD End-use data.
[3] Without specification, EU-10 in this article refers to the top ten EU importers of Chinese goods in 2021, Netherlands, Germany, France, Italy, Poland, Spain, Belgium, Czech Republic, Sweden, Hungary.
[4] Here the data refers to China's share of the EU's imports from intra- and external EU suppliers. Therefore the percentage is lower in figure 4 than in figure 1, which measures the Chinese share of extra-EU supply.
[5] For the pharmaceutical industry trade, we include both the trade data of organic chemistry and pharmaceutical sectors since active pharmaceutical ingredients can be sourced from both categories.
[6] Data Source: US Census Bureau. The pharmaceutical industry data is sourced from HS code 30, and the organic chemical industry is sourced from HS code 29.
[7] The OECD End-use data only contains data from Vietnam up to 2020. Therefore, we have used data from the Vietnamese general statistics office.