In a context of economic slowdown and the reorganisation of global supply chains, Intra- and Extra-Asian trade presented divergent pictures in 2022.
2022 has been a challenging year in many aspects. The sluggish EU and North American consumer markets, coupled with the high inventory level, resulted in a collapse of ocean freight rates since the second half of 2022. In the meantime, the intra-Asian economy, although affected by the global macro economy, proved more resilient. According to the UNTCAD, East Asia was the only region with a positive quarter-to-quarter trade growth rate in the third quarter of 2022.
What were the contributing factors to the resilience of the Intra-Asian trade? How did the changes in external demand affect the intra-regional trade in Asia? Furthermore, with the trend for supply chain diversification unfolding, how will it shape the trade with(in) Asia? This paper seeks to answer these questions with some preliminary 2022 trade data.
A More Integrated Asia
We will be comparing the trade performance of six Asian states and regions namely the ASEAN, China, Japan, South Korea, India, and Taiwan. For intra-Asia trade, we have taken into account their trade with each other but also with Australia. For extra-Asia trade, we mainly focus on their trade activities with the EU and the US[1].
In 2022, in terms of value, intra-Asia trade for the countries and regions concerned outperformed their trade with the EU and the US markets, denoting a more resilient intra-Asia trade in spite of the turbulence (Figure 1). The dynamic intra-Asian trade activity can also be observed in shipments. The throughput of Beibu Gulf, China's flagship project to improve China-ASEAN connectivity, continues a double-digit growth – the only one of the top 10 Chinese ports to do so in 2022, signaling dynamic trade activity between China and ASEAN.
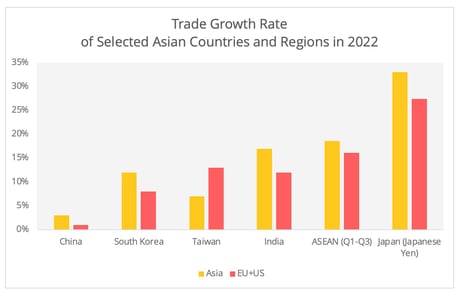
Figure 1 - ASEAN Stats, China Custom, Indian Department of Commerce, Korean Customs, Bureau of Foreign Trade, Taiwan, Ministry of Finance Japan. Japanese data is based on Japanese Yen, the rest is based on US dollar value. For ASEAN, we include intra-ASEAN trade as part of the intra-Asian trade.
In terms of direction of trade flows, Asian exports to their main external markets (the EU and the US) have surpassed their global growth rate of trade (Figure 2). For the surveyed countries and regions, the growth rate of their exports to markets outside the EU and the US fell behind those for global exports, suggesting that these two destinations remain the primary external markets for Asia.
As for imports, their intra-Asia growth rate (with the exception of Taiwan) surpassed that of their imports from the EU and the US, however, with the exception of Japan, none of the surveyed actors recorded higher intra-regional import growth compared to that of their global imports in 2022. This could be attributed to soaring energy prices.
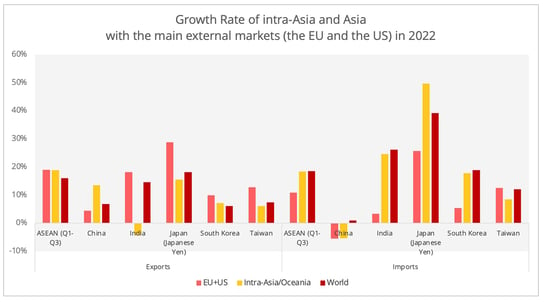
Figure 2 - Data Sources: ASEAN Stats, China Custom, Indian Department of Commerce, Korean Customs, Bureau of Foreign Trade, Taiwan, Ministry of Finance Japan. Japanese data based on Japanese Yen, the rest is based on US dollar value. The very high Japanese import growth rate was also driven by the depreciation of Japanese Yen.
The figures above align with the long-term trend for the integration of Asia in the global value chains and its accentuated position as the world's manufacturing hub. The past five years have seen a healthy share of the EU and the US in ASEAN exports and a burgeoning proportion of Asian countries in the ASEAN's total imports[2] (Figure 3). While the external demand obviously drives the inter-regional exports, it is interesting to try to identify at the same time the elements that have contributed to the increase in intra-Asian imports.
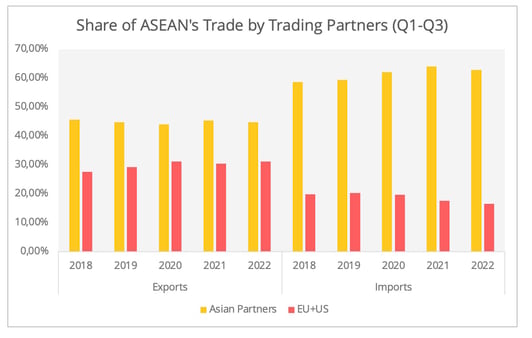
Figure 3 - Data Source: ASEAN Statistics
Recent research and trade data may suggest that the external drive is spuring intra-Asian regional trade. According to the Asian Development Bank, intra-Asian imports are more associated with industrial activities than consumer demand (Figure 4). The dominant position of intermediate goods trade between Asian countries also supports this speculation. According to OECD data, in 2021, intermediate goods accounted for between 60% and 70% of the intra-Asian trade. According to Vietnamese Customs, for example, in January 2023, 93% of their imports were production materials. However, if the intra-Asian economy is export-oriented one wonders what made intra-Asian trade more resilient when the external demand was weak.

Figure 4 - Data Source: China Customs; S&P Global ASEAN Manufacturing Index
The More Resilient Intermediate Goods Trade
One explanation could be the relative stability of external demand for Asian intermediate and capital goods, which would have mitigated to some extent the impact of the global economic slowdown on intra-Asian trade. To illustrate this hypothesis, let us look at EU-Asia trade. [3]
Despite the bleak demand in the second half of 2022, the EU imports of intermediate goods from Asia turned out to be relatively resilient compared to consumer products (excluding energy and food products) in both volume and value (Figure 5 & Figure 6)[4]. This phenomenon could have stemmed from European companies readjusting their supply chain strategies to cope with the acute energy crisis by importing certain more energy-intensive industrial products from Asia.
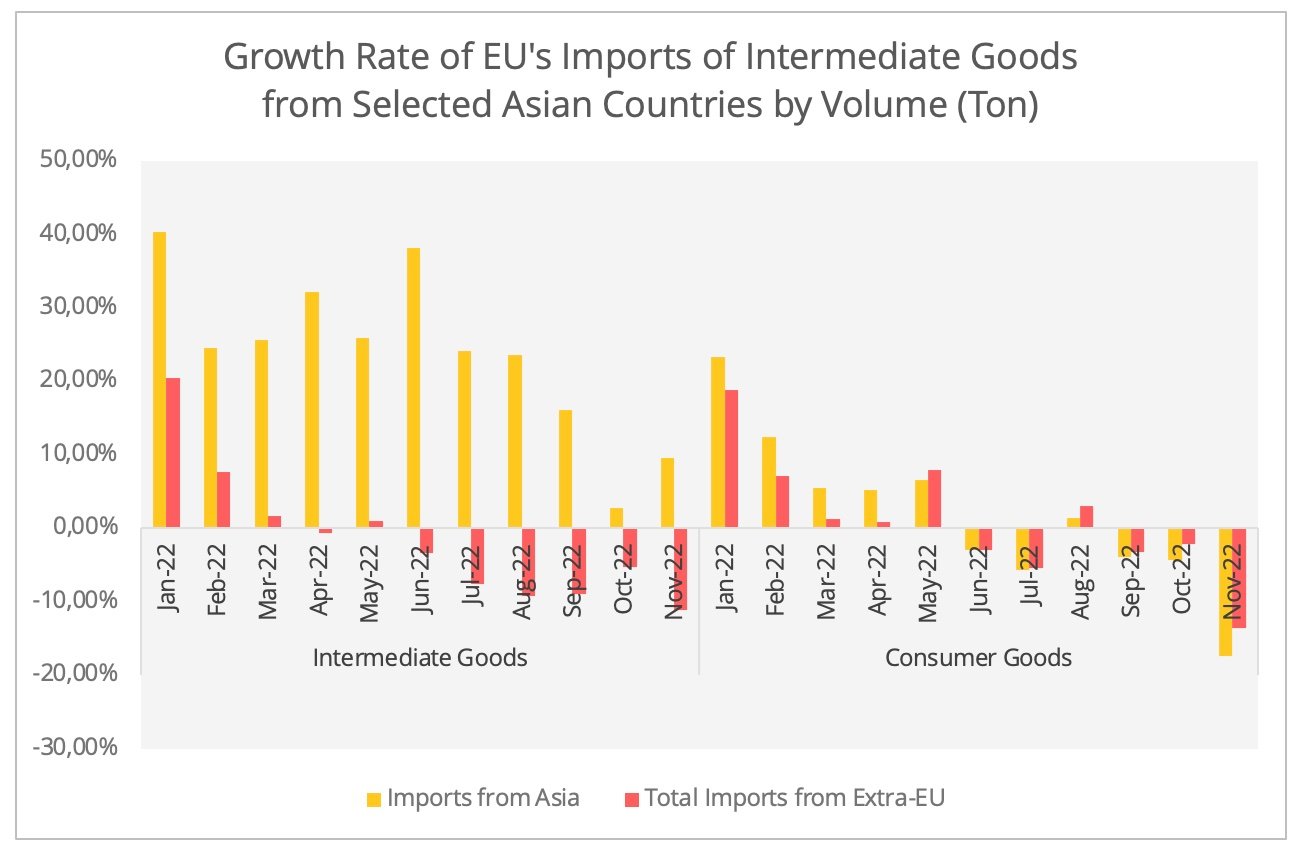
Figure 5 - Data Source: Eurostat. Asia includes China, Japan, South Korea, ASEAN, Taiwan, and India.
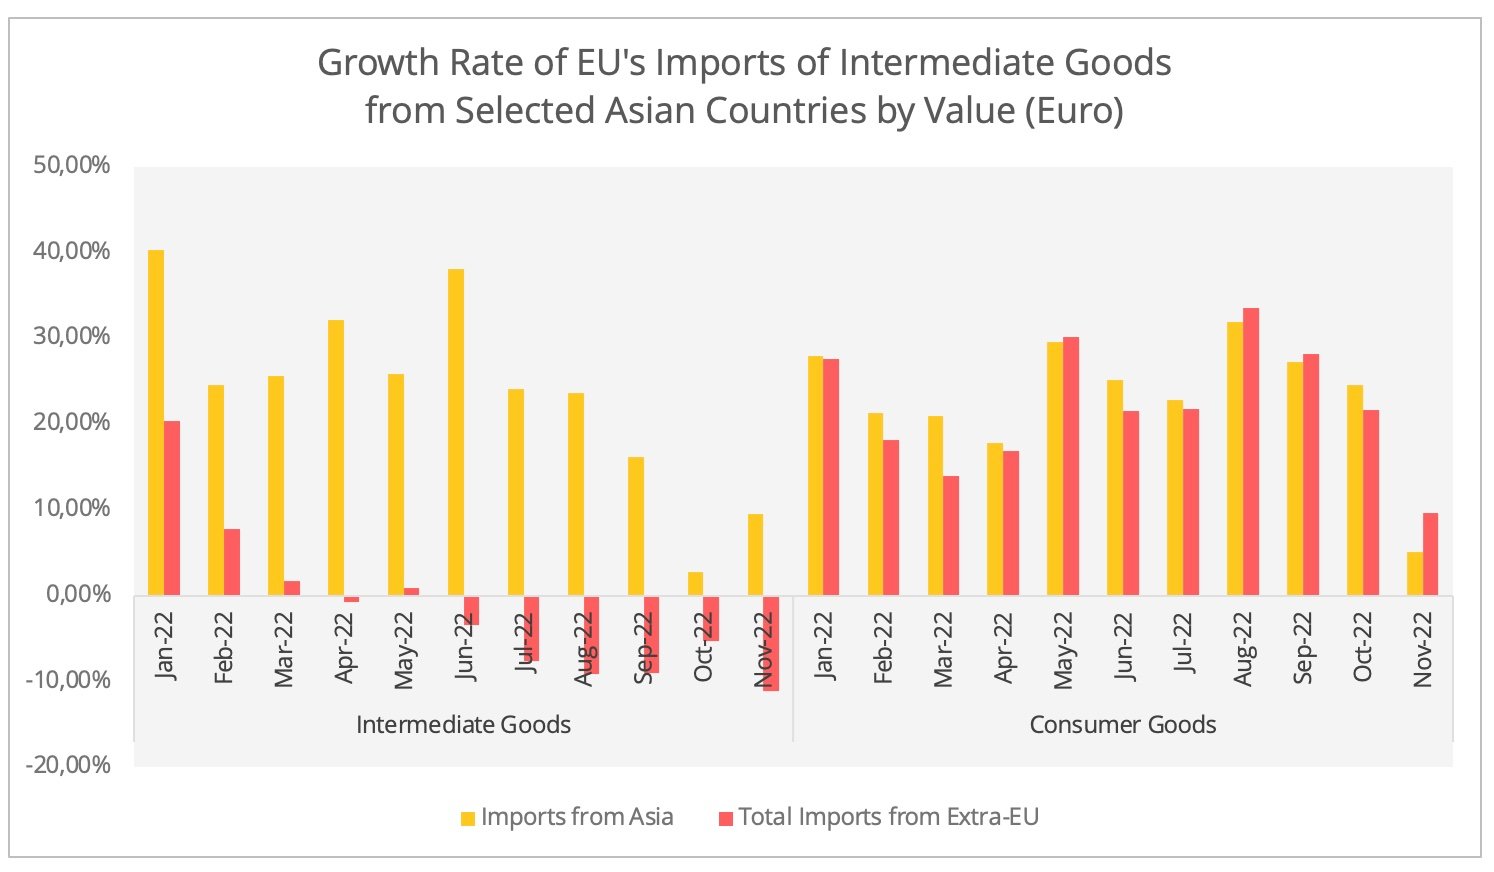
Figure 6 - Data Source: Eurostat
Furthermore, the fact that industrial goods (intermediate and capital goods) already accounted for over 70% of the EU imports from Asia may have attenuated the impact of the sharp drop in consumer goods trade[5]. Although the EU sourced only around a quarter of its intermediate goods from Asia, this accounted for 46% of total exports of the surveyed Asian countries to the EU in 2022. This contrasts with the situation for consumer goods: in 2022, Asia supplied more than half of the EU's total imports in this sector. However, only 22% of Asian exports to the EU in 2022 (in value) was driven by the demand for consumer goods (Figure 7).
Besides, even though the current Asian economic integration is more driven by external demand, the potential of the emerging Asian market, particularly ASEAN and India, should not be overlooked. They presented a flatter curve in consumer confidence compared to the steep drop in Europe or North America. For example, in 2022, Indian consumer confidence continues to recover after hitting its record low in 2021.
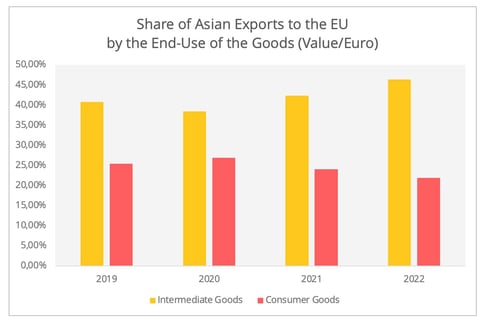
Figure 7 - Data Source: Eurostat
Supply Chain Diversification and Trade with (in) Asia
According to the UNCTAD, the global trade value in 2022 looks set to have achieved a record high of 32 trillion USD. However, with continued economic and geopolitical uncertainties, 2023 is unlikely to see this momentum continue. For trade with Asia, one phenomenon we especially need to take into consideration is supply chain diversification. In 2022, foreign enterprises with economic footprints in China have fortified a dualized strategy: on the one hand, localizing manufacturing activities in China for the Chinese market and on the other hand, diversifying their supply chain out of China. The recent Business Confidence Survey by the German Chamber of Commerce in China states that 45% of the surveyed German companies with over 250 employees are considering diversifying their supply chain away from China. If that is the case, the implementation of such a dual-tracked supply chain strategy could affect the trade with(in) Asia.
- Different Trajectories between US and EU Demands
The ASEAN and India are among the most promising diversification options. As such, we could anticipate dynamic extra-Asian trade activities between these countries and European or North American markets, including both consumer and intermediate goods. Particularly as we can now observe some subtle signs that manufacturing activities and consumer confidence in these two regions are picking up[6].
Nonetheless, their trade with the EU and the US may follow different patterns. Our previous analysis has shown that the US presented a strong trend of substituting Chinese supplies with alternatives, such as from the ASEAN or elsewhere in the region. In contrast, the EU is introducing alternative suppliers in addidition to China. These trade patterns align with the different policy approaches in dealing with diversification. This difference can be further explained by the US’s strong policy endorsements of reindustrialization and friend-shoring.
For example the US Industrial Inflation Reduction plan has motivated automotive manufacturers to localize their production in the US (with Audi being the latest example). This allows them to benefit from the tax incentives linked to EVs assembled in North America, and thus be competitive on the US market.
- China’s Central Role as an Intermediate Goods Supplier in Asia
Of course, one obstacle ahead of the supply chain diversification is China's prominent position as the main intermediate goods supplier to Asian countries, especially those with more downstream manufacturing activities (assembly) such as ASEAN, and India (Figure 8). In 2022, China's exports to these two zones increased by 17% and 21% respectively, far above its annual trade growth rate.
Indeed, one needs to aware that in 2022, intra-Asia trade excluding China has in fact presented a much stronger growth rate than trade including China in 2022. This could be due to previous Zero-COVID policy in China (Figure 9). With China entering the post-Zero Covid phase, February 2023 saw expansion (PMI > 50) in Chinese manufacturing activities for the first time in the past seven months. The ramped-up new export orders could also manifest into growth of intra-Asian trade.
Of course, foreign enterprises are expected to continue their efforts in forming new supply chain clusters outside of China despite the U-turn in its COVID policy at the end of last year. However, it could be a rather lengthy process. Particularly as the gloomy global economic outlook in 2023 may hamper the prospects of foreign direct investment, thus slowing down the diversification process.
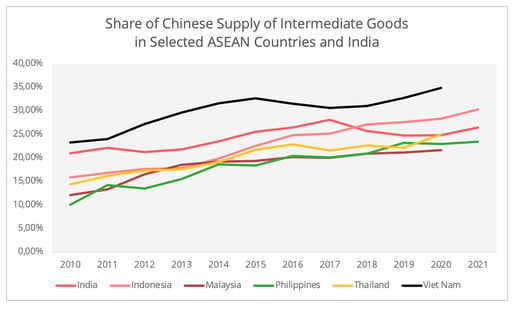
Figure 8 - Data Source: OECD End-Use Data
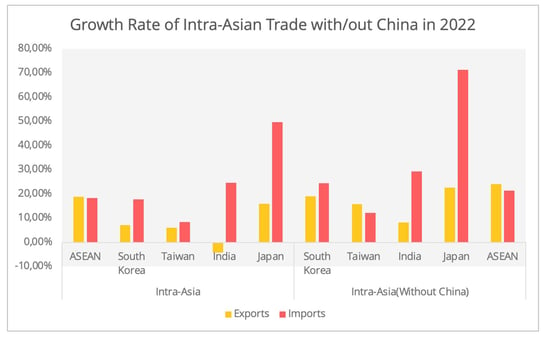
Figure 9 - Data Source: ASEAN Stats, China Custom, Indian Department of Commerce, Korean Customs, Bureau of Foreign Trade, Taiwan, Ministry of Finance Japan. Except for Japanese data is sourced based on Japanese Yen, the rest is all based on US dollar value.
[1] In this paper, without specification, all statistics concerning Asia refer to those of these six regions or countries.
[2] The main Extra-Asian partners include the EU and the US. The main Asian partners include mainland China, Taiwan, South Korea, Japan, India, Australia, and ASEAN.
[3] The EU-Asia trade here is selected as an example due to data availability concerns.
[4] The data related to intermediate goods and consumer goods are based on BEC categorization. As our focus is on the manufacturing industry, we excluded commodities in the food and energy sectors. Intermediate goods refer to codes: 21*, 22*, 42*, and 53*. For consumer goods, we included: 510, 522, 61*, 62*, and 63*.
[5] This is based on the data from Eurostat.
[6] For more details, see the PMI for the EU and for the US.