The pandemic and the changing geopolitical dynamics have highlighted India as a promising supply chain diversification option. Using the latest trade and investment data, this article explores India’s current standing in the changing supply chain reconfiguration.
Asymmetrical Trade Position
Overall, in the first eight months of 2022, India's exports surged by 23%, and imports increased by 40%. The US and the EU are its two largest export markets, accounting for 35% of total exports, with year-on-year growth of 23% and 35% respectively.
In contrast, their exports to China plummeted by 33% in the same period, driven down by the increase from 30% to 50% of Indian export tariffs on iron ore, and the weak Chinese demand due to the morose real estate market (Figure 1). In the meantime, China continues to be India’s largest supplier, with a 33% increase in the first eight months of 2022.
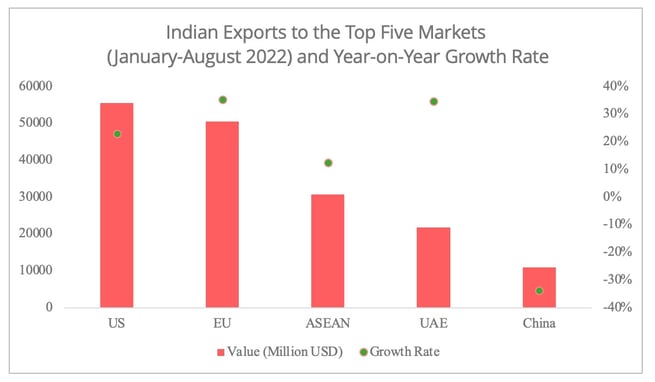
Figure 1 - Data Source: Department of Commerce of India
As for the situation in different sectors, despite refined petroleum products contributing heavily to the export value growth owing to skyrocketing energy prices, machinery goods have also presented two-digit growth. In particular in 2022, cell phones have become India’s third largest commodity export to the EU, following refined petroleum and precious stones [1]. This may be due to Apple’s move to relocate part of its production lines to India. The apparel, automotive, and chemicals sectors also showed robust export growth to the EU and US markets.
However, the trade relation remains asymmetrical. India only accounted for roughly 2% of EU and US imports. Despite the impressive 372% growth of Indian cell phone exports to the US market in the past three years [2], it contributed merely approximately 1% of the US total demand. In contrast, 78% of the US-imported mobile phones were sourced from ASEAN and China.
Burgeoning FDI Inflow
The swell of FDI inflow to the Indian manufacturing industry corresponds to the burgeoning market interest for India as an alternative to China (Figure 2). In the 2021-2022 fiscal year, the manufacturing sector absorbed most of the FDI, with a 75% growth rate, accounting for 27% of the total FDI inflow in the same period. The US and Singapore were the two largest FDI source countries to India in this period [3].
Not only did the absolute value of the FDI inflow increase, but so did the number of FDI projects. According to the UNCTAD 2022 Investment Report, 108 international project finance deals in India were announced in 2021, whereas the average annual figure over the past decade was 20. Renewables, automotive, and construction material sectors proved the most attractive, both in number of projects and value of FDI.
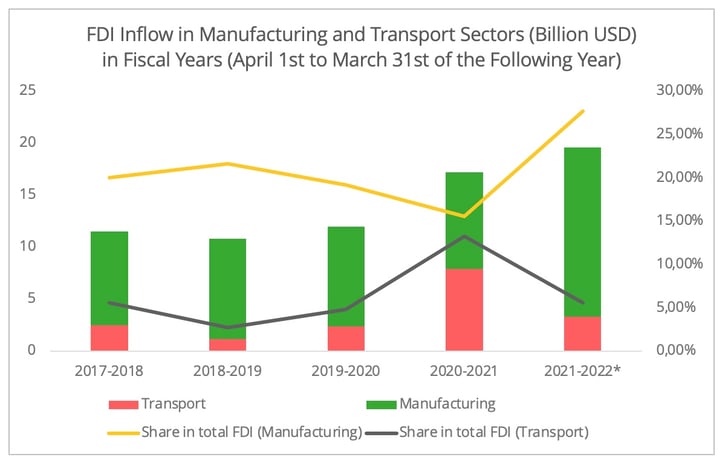
Figure 2 - Data Source: Reserve Bank of India. The Data for 2021-2022 is provisional.
Accordingly, the transport and logistics industry, as the backbone of trade, has also generated substantial market interest. Even though the FDI inflow in the Indian logistics sector eased over the fiscal year of 2021-2022, following a spike in the previous fiscal year (Figure 2), the number of greenfield projects doubled in 2021 (calendar year). They totalled 28, ranking India as ninth in the top inbound countries for FDI logistics projects worldwide, according to the report from GlobalData [4]. This trend is confirmed by the increasing commitment of the major market players in India.
- In July of 2022, CMA Terminals (CMA CGM Group) and J M Baxi Ports & Logistics Ltd formed a 30-year joint venture to develop and operate the Nhava Sheva Freeport Terminal in Jawaharlal Nehru Port, India’s second busiest port.
- In September of 2022, DHL announced an investment of 500 million USD over the next five years to grow their warehousing capacity, workforce, and sustainability initiatives.
The newly launched National Logistics Policy in September, with its strong focus on digitalizing and optimizing the Indian logistics industry, is expected to attract even more investment. One of its key target areas, in particular, is to reduce its logistics costs which currently stand at 13-14% of India’s GDP to a single digit by 2030. However, this may turn out to be a very ambitious vision. For example, China’s figure has stagnated at around 14% over the last decade, despite extensive digitalization efforts and infrastructure investment in past years.
Can India keep up the momentum?
Undoubtedly, the latest trade and investment statistics portray a rapidly rising India. According to the latest IMF economic outlook, India stands out with a forecasted 6.8% GDP growth rate in 2022 and a projected 6.1% growth in 2023, the highest among the emerging Asian countries [5]. This contrasts with the more modest projected world growth of 2.4% in 2022 and 1.1% in 2023. The question is, to what extent can India keep the momentum going? Here we look into some factors that could influence long-term projections.
- Participation in Regional Economy
One major challenge, perhaps, is when compared to other supply chain diversification options, such the ASEAN (Figure 3), India has a relatively less well-established manufacturing sector and is less well-integrated into the regional economy. For example, manufactured goods comprised 68% of Indian total exports in 2021, below the world average of 72% (Figure 4). This means extensive financial investment is needed to transform its manufacturing industry. However, these prospects may be compromised by the gloomy economic outlook and very modest global trade growth (1.1% according to the latest WTO forecast).
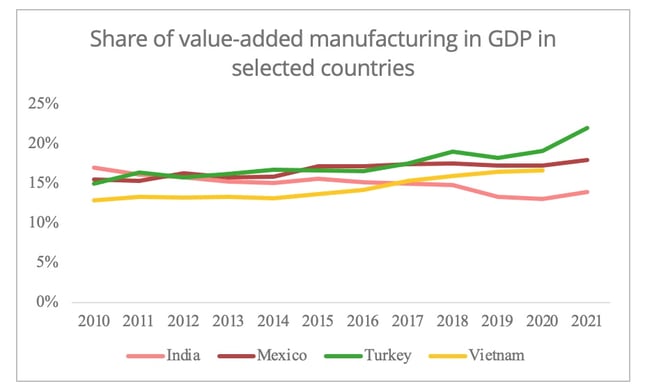
Figure 3 - Data Source: World Bank
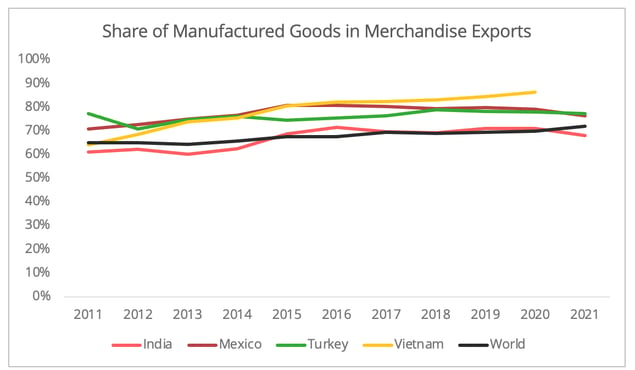
Figure 4 - Data Source: World Bank [6]
Furthermore, India has integrated neither the Comprehensive and Progressive Agreement for Trans-Pacific Partnership (CPTPP) nor the Regional Comprehensive Economic Partnership (RCEP). In light of the trend in regionalizing supply chains, tariff and non-tariff trade barriers could undermine its attractiveness, especially for industries with complex globalized supply chains (Figure 5). Although it has joined the Indo-Pacific Economic Framework (IPEF) initiated by the Biden Administration, this is not a trade agreement that grants market access and tariff reduction.
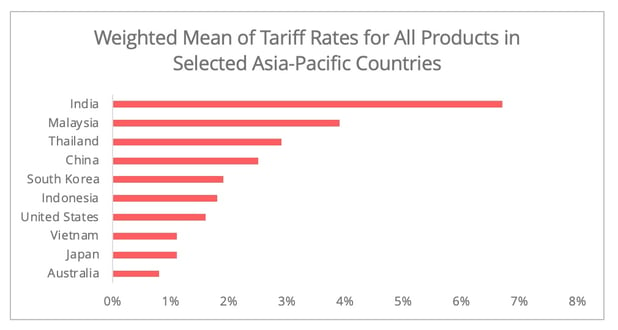
Figure 5 - Data Source: World Bank
One positive note may be the prospect of the EU-India Free Trade Agreement, which could facilitate EU-India trade activities. The negotiation was rebooted in June 2022, and both sides have jointly agreed to fast-track the agreement by 2023.
Also, in the short term, India's well-stocked oil reserves could be a major advantage in light of ongoing energy shortages. However, its heavy reliance on coal may suggest a bumpy road towards the energy transition required to support long-term expansion. The markets also seem to see this area as an opportunity, as most international project finance deals in India took place in renewables (23/108) in 2021, according to the UNCTAD 2022 Investment Report.
One advantage of being less well-integrated in the regional economy may be that India is less economically vulnerable to China than the ASEAN or other major Asian countries such as Japan and South Korea. Its trade with China accounted for 11% of its total trade in 2021, whereas the figure was around 25% for the ASEAN. The Chinese market only constituted 3% of India’s total exports in 2021, while 18% of the ASEAN exports went to China. In the political dimension, ASEAN and India have territorial disputes with China. However, the geographic proximity and the significant power asymmetry between the ASEAN countries and China make ASEAN countries more vulnerable to China.
Nevertheless, its less well-established manufacturing capacity and the rapid expansion of production in India means an inevitable increase in demand for Chinese intermediate goods supply, the exact same issue that the ASEAN is facing. In 2021, Indian imports from China jumped by 49%, three-quarters of which was due to increasing demand for intermediate goods (Figure 6). In its rapidly expanding machinery manufacturing industry, 45% of the imported intermediate goods were from China in 2021 (Figure 7). Strikingly, the share is, in fact, much higher than ASEAN countries. However, it is important to realise that supply chain reconfiguration does not manifest itself overnight. Apple’s decision to relocate a part of its production line to India could motivate suppliers to make similar moves in the near future in order to decrease reliance.
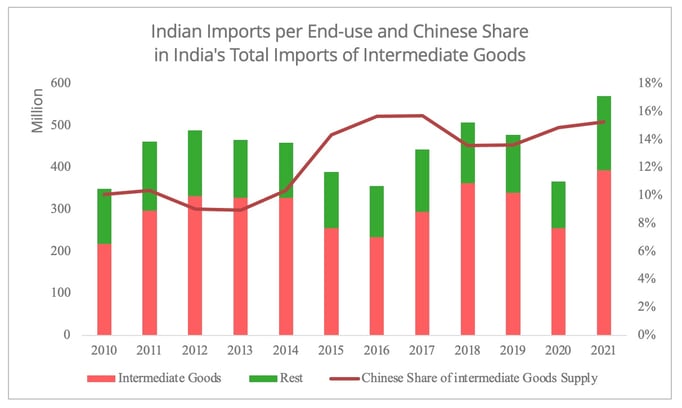
Figure 6 - Data Source: OECD End-Use Data.
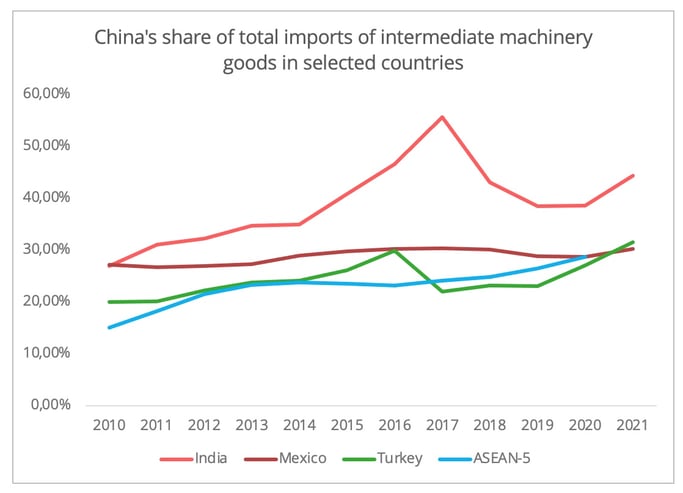
Figure 7 - Data Source: OECD End-Use Data [7]
Geopolitical concerns now play a crucial role in States’ supply chain policy design, bringing both opportunities and challenges to India. For example, the latest US National Security Strategy, has defined two of its priorities as being out-competing China and containing Russia, this could prove conflictual to India’s interests.
On the one hand, it is precisely the growing tension between China and the US that grants India an amplified role in the US Indo-Pacific strategy. With political reliability now being a priority in States’ supply chain policy design, such a phenomenon could fortify the interests of the West in tightening its economic connections with India. For example, the EU not only resumed the free trade agreement negotiations, but also launched the EU-India connectivity partnership, funding infrastructure projects in India, including its transport sector, via the Global Gateway Scheme.
On the other hand, we should not ignore the long-established Russia-India relation. Russia still accounts for 40% of India’s defence supply, meaning long-term Indian needs for Russian maintenance services. The institutional effort from the US to foster friend-shoring will reduce India’s capacity to balance their relations with Russia and the US. Furthermore, the unresolved China-India border crisis could also raise risks of economic retaliation from either side in the case of an escalation in the conflict.
[1] This ranking is based on four-digit HS code, and the HS code for cell phones is 8517.
[2] This is based on data from the US Census Bureau.
[3] The data from Indian Reserve Bank does not specify the FDI value per country per field.
[4] The number by GlobalData suggested that greenfield projects in Indian logistics sector might be different from the number from the UNCTAD investment report, since the latter indicates that the renewables accounted for the highest number of projects in 2021, which was 23. However, this could be due to different methods in data collection. Here we included the information from both sources, since the trends in both reports offer valuable insights on the development in India.
[5] The emerging Asian countries in this context include the ASEAN and China.
[6] Indeed, this percentage in developed economies may also be below the world average, such as the US (58%), driven by deindustrialization. However, as a developing country India’s below-average share may be an indicator of its less established manufacturing activities.
[7] Here we only looked at the five ASEAN countries that are the main supply chain diversification options: Vietnam, Thailand, Malaysia, Indonesia, and the Philippines.