After a nearly 6-month long truce in the trade war, all the progress made in the past is now at stake, as the US and China impose more sanctions on each other’s goods this early May. While there has been a lot of discussions about the trade war, this article will look more specifically at the relationship between tariff policies and container shipping.
Looking at the tariff policies so far
On May 10th, the US raised tariffs to 25% on $250 billion worth of Chinese imports to the US.
The tariff list covers a wide range of items, from industrial products to consumer goods such as toys, furniture, and sporting equipment. According to the Peterson Institute of International Economy, the remaining US imports from China subject to this round cover 100% of toys and sporting equipment, 93% of footwear, 90% of textile and clothing, and 55% of electronic and electrical machinery (1).
Additionally, on May 14th, the US announced another tariff list covering $300 billion worth of products, including more consumer goods and agricultural products. Considering that machinery, electronic machinery, furniture and bedding, toys and sporting equipment, and plastics were the top 5 import categories (2) in 2018, this means the US tariff increase targets top imports from China.
Shortly after the announcement, China imposed 25%, 20%, and 10% tariffs on a range of US products amounting to $60 billion worth of imports, starting on June 1st, 2019 (for those at 5% will remain 5%). This increase targets the following product categories (3): section 16 (Machinery and Mechanical Appliances), section 11 (Textile), and section 6 (Products of the Chemical or Allied Industries), which are the top 3 categories in terms of number of items, and for which most items have a 25% tariff rate. The tariff does not directly target all the most imported product categories. In 2018, China’s biggest American import types were aircrafts, machinery, electric machinery, optical and medical equipment, and vehicles. China most likely imports these types of goods because it cannot find substitute suppliers in other countries.
Container shipping volumes during the trade war
Trade war has a substantial impact on trade between China and the US. But what is the true impact on shipping? Trade value is not a good reflection of shipping volume. For example, a small sophisticated electronic device has a high monetary value but does not take up a lot of space for shipping.
To address this question, we’ll look at the Trans-pacific Westbound (US to China) and Eastbound (China to the US) container shipping volumes for 2018, based on the data provided by the US Department of Commerce. We’re looking to see how the tariffs imposed by the US and China in 2018 affected container shipping volumes, which would help assess how the intensification of the trade war impacts the industry.
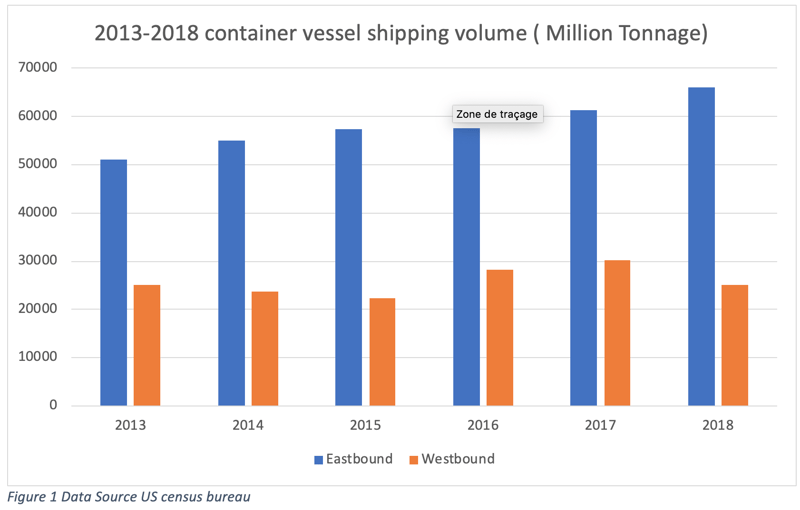
The container shipping volumes for Westbound shipping decreased by 16.9% in 2018, as compared to 2017 (Figure 1). This drop was partially caused by the trade war.
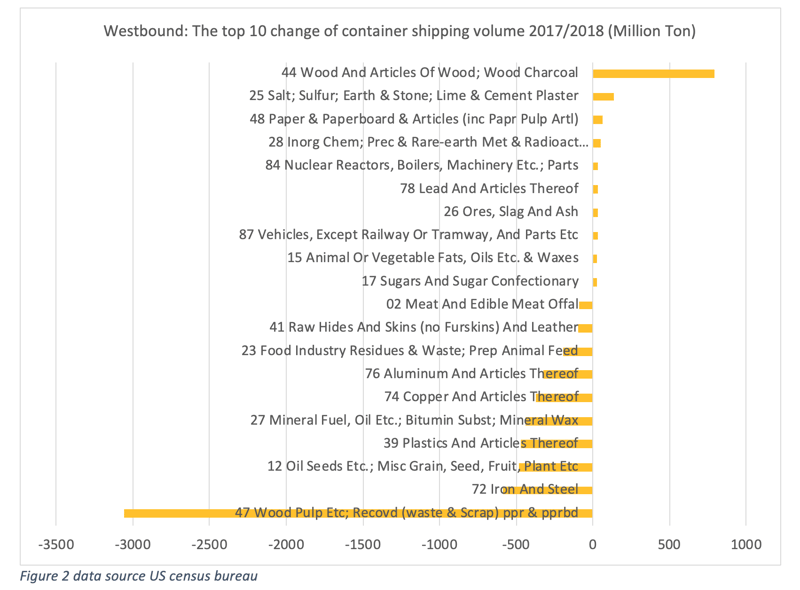
Among the top 5 categories of goods shipped (in terms of volume) in 2018, three have experienced significant decreases. The highest drop of shipping volume came from the recycling industry, whose decrease accounts for 47.6% of the total container shipping volume reduction for Westbound shipping (figure 2). However, the sharp decline was mainly due to the 2017 Chinese policy prohibiting the entry of foreign garbage. Thus, while this category was in the Chinese tariff list on US products passed in August 2018, the trade war didn’t cause this category’s decline: the sharp decrease started in January 2018.
This graph only lays out the top 10 with most important increases and the top 10 with most important decreases. Same for figure 4.
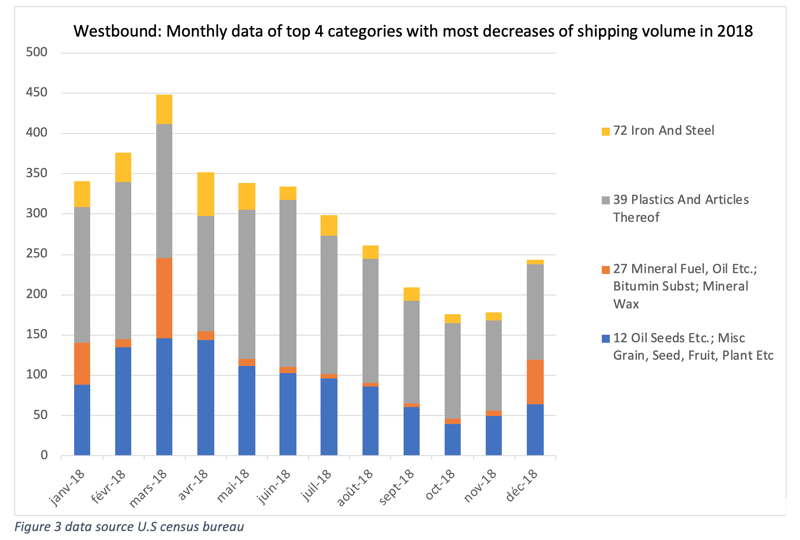
How about other items? “Waste” category (HS code 47) aside, 4 categories, which are mainly food, plastics and metal products, accounted for 30.7% of the total decrease in 2018. This decrease in shipping volumes somewhat stems from the Chinese tariff policy. The monthly data of top 4 most important decreases (excluding the “waste” category) share the same pattern of decline of shipping volume between August and November 2018 (Figure 3). This corresponds to when the tariff was imposed by China last year, on August 23rd.
Looking at Eastbound shipping, in 2018, the overall container shipping volume was 7.8% higher than in 2017 (figure 1), which was the highest increase rate in the past five years. This can be attributed to the export rush of August and September 2018.
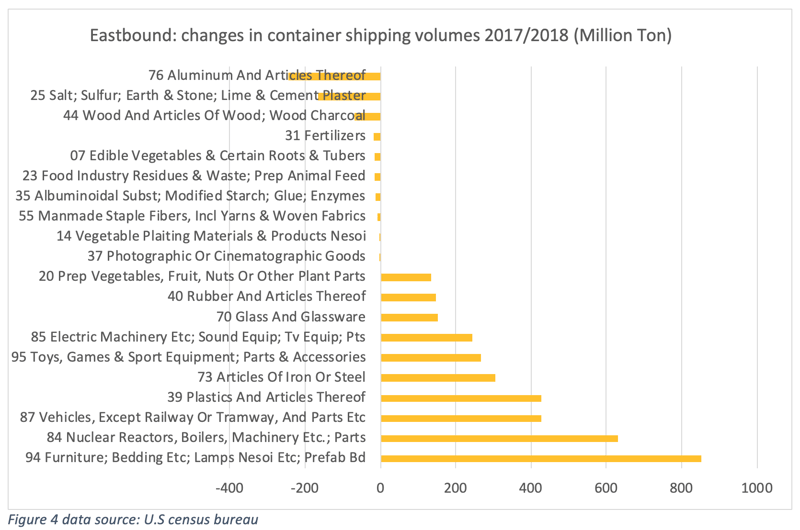
Breaking down shipping volumes by category, we see that the 3 largest decreases are for “Aluminum and Articles Thereof," “Salt; Sulfur; Earth & Stone; Lime & Cement”, and “Wood and articles of Wood" (Figure 4). The latter two categories are also two of the top 3 highest increases for Westbound container shipping (Figure 2).
The decrease was compensated by increases in other categories, like furniture, machinery, plastics, toys, and metal products. The 7 categories with the highest growth also represent the top 7 highest shipping volumes in 2018, although in a different order. They accounted for 54.9% of the total volume shipped in containers. As many of the top 7 categories are key targets of the new US tariff list on Chinese goods, Eastbound shipping may feel the consequences of this policy.
This graph only lays out the top 10 with most important increases and the top 10 with most important decreases.
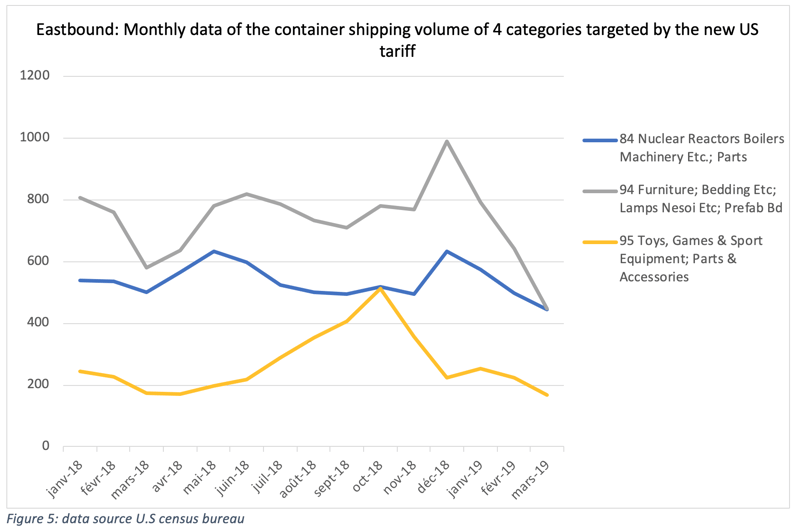
However, the extent of the tariff’s impact on container shipping also depends on the amount of extra inventory accumulated by industry players. Figure 5 outlines the monthly shipping volume for furniture, toys, machinery parts, and consumer goods targeted by the latest US tariff increase.
The monthly data shows that, with the exception of toys, volume for the four categories have increased in December 2018, which is different from patterns from the previous years (Figure 5). This could be linked to the truce in the trade war announced on November 30th, 2018, during which industry players bought more inventory to prepare for any possible uncertainty. Besides, the “toy” category also experienced a significant year on year growth from September till the end of 2018, which would also lead to extra inventory in the US. While this can be good news for consumers, it might be detrimental to containerized shipping. With the extra inventory and the imposed tariff, the demand for shipping can quickly decrease.
The findings here can lead to the following interpretations:
- The total Westbound shipping volume will continue to decrease for two reasons: firstly, China’s policy of prohibiting waste from foreign countries will continue to negatively impact Westbound shipping, especially since it accounted for a significant part of the total shipping volume. On the other hand, some of the categories (e.g. “Plastics”, “Oil Seeds”) with high container shipping volumes in 2018 continued to be targeted in the list and have been experiencing decreases.
- Eastbound shipping may get saturated, given that players in some high-volume categories have built up inventory in the past.
The US-China trade war, which seemed to be reaching an end, is now being dragged into another marathon. Fortunately, the trade negotiations are still going, despite crucial issues remaining unsolved. Meanwhile, issues around Huawei and tension in South China Sea continue to add uncertainty to the already fragile Sino-U.S relation. Furthermore, beyond affecting the world’s two largest economies, this trade war has important repercussions on the entire global supply chain. What is the impact on China’s and America’s trading partners, for instance, the EU and Southeast Asia? We will address this topic in our next market insight.
- Notes
- (1) Here only listed the items that cover over 50%. Details please see: https://piie.com/blogs/trade-investment-policy-watch/trumps-2019-protection-could-push-china-back-smoot-hawley-tariff
- (2) If not specified later, the category here refers to 2-digit Harmonization System Code, which is used in the US department of commerce for their datasets on trade.
- (3) is defined by HS codebook, each section contains a few categories (HS 2-digits). For instance, section 16, contains category 84 and 85.
Photo credit: Dreamstime