INFOGRAPHICS. The renewed tariff war initiated by the United States has not undermined the growth of Chinese ports. American and European ports are also showing positive trends, albeit more uneven.
1/ The global Top 20
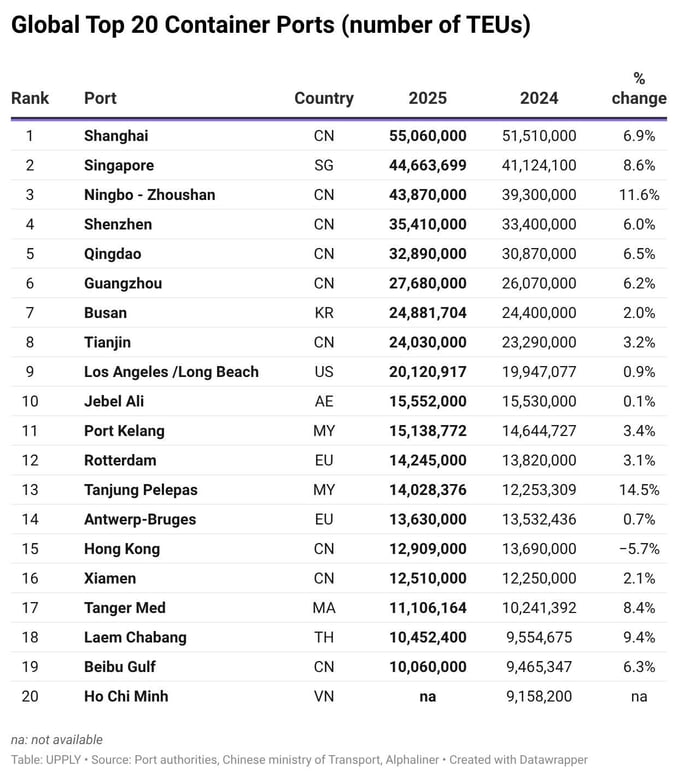
In 2025, the world's top 20 ports generated a combined traffic of nearly 450 million TEUs, representing growth of around 5 to 6% compared to the previous year according to the preliminary results we have obtained. The Top 10 remains unchanged, although with more or less dynamic trajectories, depending on the port authority.
-
Asian ports continue to dominate the global port scene, with 15 facilities among the top 20. Indeed, the port of Ho Chi Minh has not yet published its data for the whole of 2025, but the trends observed during the year suggest that it will have gained two places in the ranking compared to 2024, thus entering the Top 20. China's pre-eminence, in particular, remains undeniable. The country's ports hold 4 of the top 5 places worldwide, 6 of the top 10 places and 9 of the top 20 places. Shanghai is more than ever in the lead with over 55 million TEUs handled in 2025. The 50 million mark was crossed in 2024. Hong Kong, on the other hand, is recording a 4th consecutive year of decline, falling below the 13 million TEU mark.
-
-
The weakest growth among the Top 10 was in Los Angeles/Long Beach, affected by the trade war, and Jebel Ali, weakened by the resurgence of the conflict in the Middle East. External events of a geopolitical nature therefore have a significant impact on the development of port performance. In fact, they can also have a positive impact in some cases. This is what we can observe in the Malaysian port of Tanjung Pelepas, which boasts the highest growth rate among the Top 20. Taking advantage of its position as a transshipment hub, this port recorded growth of 14.5%, which allowed it to gain three places in the ranking.
-
-
The only two European ports in the Top 20, Rotterdam and Antwerp-Bruges, retain their ranking despite growth below the world average. Tanger Med, which entered the Top 20 in 2023 and remains to this day the only representative of the African continent, retains its 17th place.
2/ European Top 10
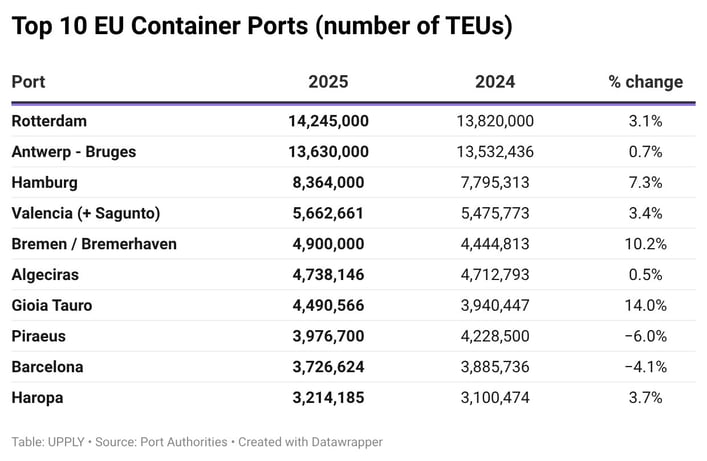
The combined container traffic of the top 10 European ports amounts to 67 million TEUs in 2025, representing a growth of 3.1% compared to the previous year.
-
While Rotterdam and Antwerp maintain a comfortable lead, German ports stand out due to their significant progress. The Port of Hamburg Authority specifies that "the upward trend in the container segment was driven in particular by traffic with China (+6.5%), Malaysia (+84.3%) and India (+49.2%)." Conversely, traffic with the United States contracted by 25.6%, illustrating the impact of customs tariffs on business.
-
The big winner of 2025 in the European Top 10 remains Gioia Tauro, which moves from 8th to 6th place thanks to growth of 14%. The Italian port has crossed the 4 million container threshold for the first time, consolidating its position as the country's leading port.
-
As for Spanish ports, the first two, Valencia and Algeciras, have saved their growth. On the other hand, Barcelona has lost ground. However, this poor performance deserves to be put into perspective. In 2024, the Catalan port experienced exceptional growth of 18.5%, due to the conflict in the Red Sea. The bypass via the Cape of Good Hope is still relevant, but the flows have now been reorganised.
-
The port of Piraeus, meanwhile, continues to be penalised by the situation in the Red Sea.
-
Haropa, the only French representative in the Top 10, is in line with the European average for the Top 10 with a growth of 3.2%. The other two ports in the top three French ports have had very different trajectories. In Marseille, container traffic is essentially stable, at 1.45 million TEUs, while it jumped by 144% in Dunkirk to reach 747,086 TEUs. Dunkirk thus equals its historical record from 2022.
3/ US Top 10
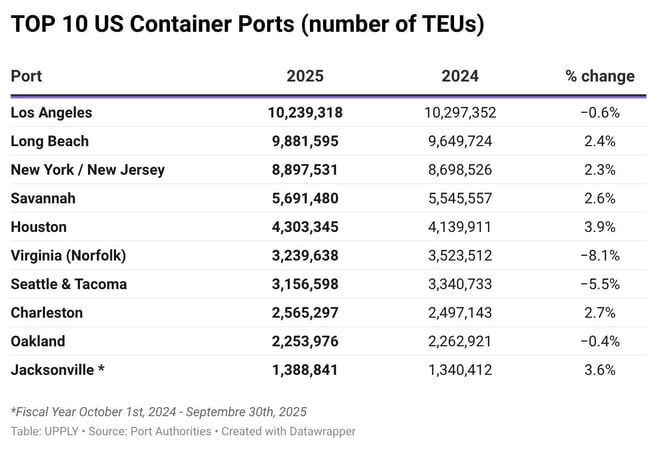
After a strong rebound in 2024, US ports experienced a marked slowdown in growth, shaken by the upheavals of the trade war. The combined traffic of the Top 10 amounted to 51.6 million TEUs, a modest increase of 0.6% compared to the previous year. At the beginning of the year, the announcement of the imminent introduction of additional customs duties boosted traffic due to frontloading, but the second half was much calmer.
-
The pair Los Angeles / Long Beach, the main maritime gateway to the United States, recorded cumulative traffic of 20.1 million TEUs, up 0.9%, thanks to the performance of the Long Beach terminals, while Los Angeles showed a decline of 0.6%. The port of Los Angeles is suffering from the fall in full container exports (-4.35% to 1.4 million TEUs) and to a lesser extent in full container imports (-0.7% to 5.3 million TEUs). Long Beach also saw a decline in exports (-5.5% to 1.1 million TEUs), but growth in full container imports (+1.1% to 4.8 million TEUs) saved the overall result.
-
Still on the West Coast, the ports of Seattle/Tacoma also suffered from the overall context of global trade with a decline of 5.5%. After experiencing a sharp increase the previous year (+19.6%), the traffic of full import containers fell by 10.3% to 1.16 million TEUs. Exports declined by 4.9%.
-
Oakland For its part, it shows a slight erosion, but is distinguished by a growth in exports of full containers (+7.4% to 787,289 TEUs). On the other hand, the figure for imports is down by 0.6% to 958,223 TEUs.
-
On the East Coast, New York was able to capitalise on the good performance of full container exports, up 6.5% to 1.45 million TEUs, while imports increased by 1.7% to 4.51 million TEUs. It thus easily confirms its 3rd place in the Top 10 ports of the United States. Savannah, Charleston and Houstonalso recorded very satisfactory results, with the latter even breaking a traffic record despite the turbulent period. The port authorities see this as the fruit of the efforts made in recent years in terms of investment.
-
On the other hand, the port of Norfolk (Virginia) lost all the ground gained in 2024, suffering erosion in all segments : empty containers, full containers, imports and exports. Full container traffic declined by 6.2% for imports (1.53 million TEUs) and by 7% for exports (1.06 million TEUs).
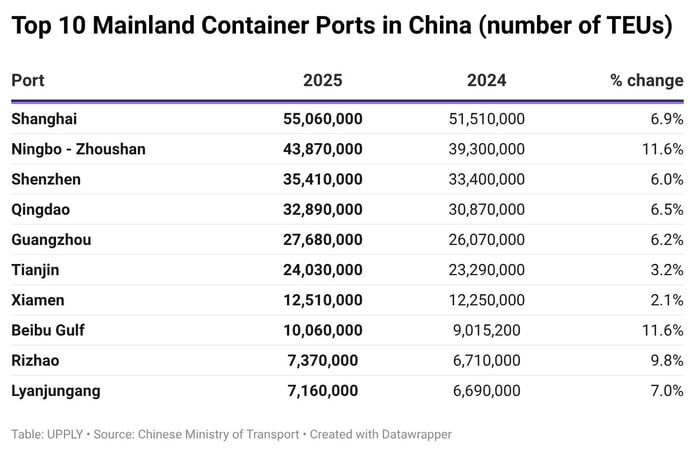
4/ China's Top 10
The tariff war launched by the United States has not significantly impaired the growth of Chinese ports. In the first part of the year, this policy actually boosted activity, essentially as China redirected its flows, particularly towards the European market. The Chinese Top 10 therefore unsurprisingly shows the best growth, compared to the United States and Europe. With a cumulative traffic of 256 million TEUs, it shows an increase of 7.1%. It is also distinguished by the fact that no port in the Top 10 recorded declining results in 2025.
-
Shanghai, the number 1 port in China and the world, continues to impress, handling more containers on its own than the top 10 ports in the United States combined.
-
Located about 200 km to the south, the number 2 port, Ningbo-Zhoushan, stands out with a second consecutive year of double-digit growth, allowing it to cross the 40 million TEU mark.
-
Further down the rankings, we also note the continued solid progress of the Beibu Gulf port ecosystem, which includes three ports located in coastal cities in the Guangxi Zhuang region. Traffic increased by 11.6%, after already increasing by 12.4% in 2024, 14.2% in 2023 and 16.8% in 2022. This trajectory is supported by the rapid development of intra-regional flows.